Elastic Stack 7 : Auditbeat インストール2019/06/18 |
|
監査アクションの監視機能を提供する Auditbeat をインストールします。
|
|
| [1] | Auditbeat をインストールします。 事前に Elasticsearch リポジトリ設定済みであることが前提です。 |
|
[root@dlp ~]# yum -y install auditbeat
|
| [2] | 基本的な設定をして Auditbeat を起動します。 |
|
[root@dlp ~]#
vi /etc/auditbeat/auditbeat.yml # 13行目:監査アクションの設定 (書式は auditctl と同じ)
- module: auditd
  audit_rules: |
    ## Define audit rules here.
    ## Create file watches (-w) or syscall audits (-a or -A). Uncomment these
    ## examples or add your own rules.

    ## If you are on a 64 bit platform, everything should be running
    ## in 64 bit mode. This rule will detect any use of the 32 bit syscalls
    ## because this might be a sign of someone exploiting a hole in the 32
    ## bit API.
    #-a always,exit -F arch=b32 -S all -F key=32bit-abi

    ## Executions.
    #-a always,exit -F arch=b64 -S execve,execveat -k exec

    ## External access (warning: these can be expensive to audit).
    #-a always,exit -F arch=b64 -S accept,bind,connect -F key=external-access

    ## Identity changes.
    #-w /etc/group -p wa -k identity
    #-w /etc/passwd -p wa -k identity
    #-w /etc/gshadow -p wa -k identity

.....
.....
# 111行目:Kibana を使用する場合はコメント解除して出力先を指定 # Kibana で SSL 有効の場合は証明書に登録したホスト名と合わせる
setup.kibana:
.....
  host: "https://dlp.srv.world:5601"
# 114行目:出力先を指定する # デフォルト出力先は以下のように localhost の Elasticsearch # Logstash に出力する場合はコメントアウトして output.logstash 行関連を有効にする output.elasticsearch: # Array of hosts to connect to.l hosts: ["localhost:9200"] ..... ..... #output.logstash: # The Logstash hosts #hosts: ["localhost:5044"]
[root@dlp ~]#
vi /etc/auditbeat/auditbeat.reference.yml # 34行目:auditd モジュールの基本設定 - module: auditd resolve_ids: true failure_mode: silent backlog_limit: 8196 rate_limit: 0 include_raw_message: false include_warnings: false audit_rules: | ..... .....[root@dlp ~]# systemctl start auditbeat [root@dlp ~]# systemctl enable auditbeat
|
| [3] | データが取り込まれているか確認しておきます。 |
|
# index 一覧 [root@dlp ~]# curl localhost:9200/_cat/indices?v health status index uuid pri rep docs.count docs.deleted store.size pri.store.size green open .kibana_1 OD2lQaCLQFeG7RQbYXigEA 1 0 1526 110 910.4kb 910.4kb yellow open test_index u5nanOeOSCmGbSIlrqluZA 1 1 1 0 5.2kb 5.2kb yellow open packetbeat-7.1.1-2019.06.14-000001 azF2ujw4RAeZ9pgdDvRBUg 1 1 10630 0 6.5mb 6.5mb yellow open auditbeat-7.1.1-2019.06.14-000001 vyzQQ9ytQRi4fZGULSXTFQ 1 1 2169 0 1.1mb 1.1mb green open .kibana_task_manager yuJ1nGaBSDeoeP6GToztbg 1 0 2 0 12.8kb 12.8kb yellow open heartbeat-7.1.1-2019.06.14-000001 XdKYmJr1QKmj1LOtVaz-hQ 1 1 97 0 154.5kb 154.5kb yellow open sshd_fail-2019.06 Q689hZJTTjG6beQ6XtZsXw 1 1 45 0 114.3kb 114.3kb yellow open metricbeat-7.1.1-2019.06.14-000001 5cFmXcywQVWZTKvPMsZdoQ 1 1 9107 0 5.4mb 5.4mb yellow open filebeat-7.1.1-2019.06.14-000001 sWGv-hPVRuqon6m4ElZYng 1 1 41530 0 8.1mb 8.1mb # indexのドキュメント一覧 [root@dlp ~]# curl localhost:9200/auditbeat-7.1.1-2019.06.14-000001/_search?pretty
{
  "took" : 2,
  "timed_out" : false,
  "_shards" : {
    "total" : 1,
    "successful" : 1,
    "skipped" : 0,
    "failed" : 0
  },
  "hits" : {
    "total" : {
      "value" : 2193,
      "relation" : "eq"
    },
    "max_score" : 1.0,
    "hits" : [
      {
        "_index" : "auditbeat-7.1.1-2019.06.14-000001",
        "_type" : "_doc",
        "_id" : "fScGVWsBAsE_Rtb7f9Ar",
        "_score" : 1.0,
        "_source" : {
          "@timestamp" : "2019-06-14T08:06:53.297Z",
          "ecs" : {
            "version" : "1.0.0"
          },
.....
.....
|
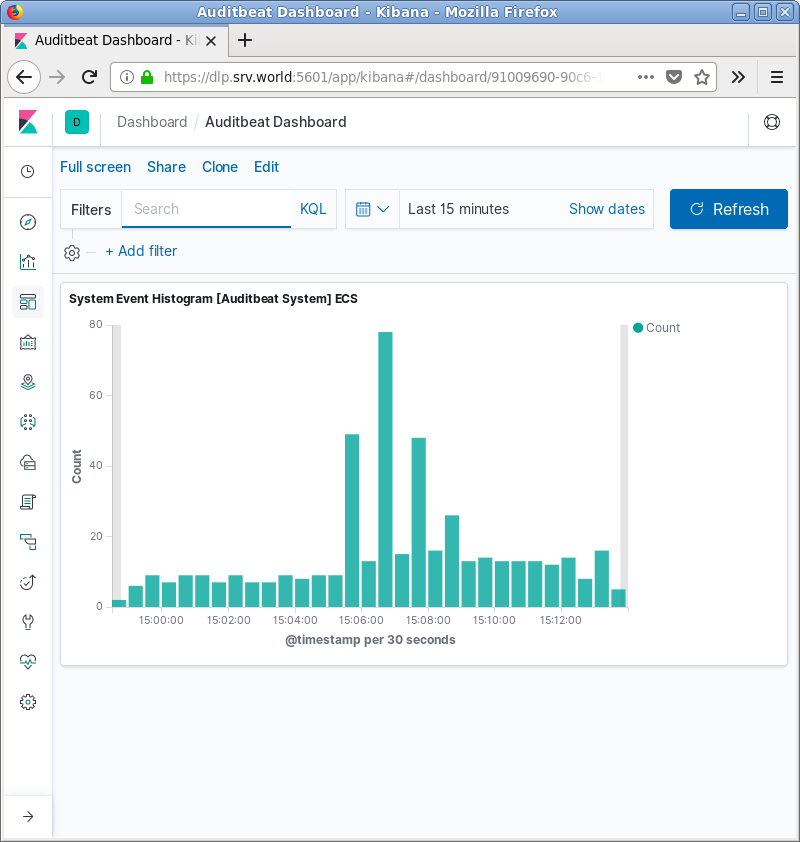
| [4] | Kibana を稼働させている場合は、サンプルダッシュボードへのデータインポートが可能です。 |
|
[root@dlp ~]# auditbeat setup --dashboards Loading dashboards (Kibana must be running and reachable) Loaded dashboards |
|
関連コンテンツ