Elastic Stack 6 : Packetbeat インストール2018/02/12 |
|
ネットワークパケット情報のデータ収集機能を提供する Packetbeat をインストールします。
|
|
| [1] | Packetbeat をインストールします。 事前に Elasticsearch リポジトリ設定済みであることが前提です。 |
|
[root@dlp ~]# yum -y install packetbeat
|
| [2] | 基本的な設定をして Packetbeat を起動します。 |
|
[root@dlp ~]#
vi /etc/packetbeat/packetbeat.yml # 29行目:収集する項目を設定 # ICMPv4/ICMPv6 を無効にする場合は false に設定 # 34行目以降:デフォルトで多くのポートが監視対象となっているが # 無効にする場合は [ports: ***] をコメントアウト packetbeat.protocols: - type: icmp # Enable ICMPv4 and ICMPv6 monitoring. Default: false enabled: true - type: amqp # Configure the ports where to listen for AMQP traffic. You can disable # the AMQP protocol by commenting out the list of ports. ports: [5672] ..... ..... # 146行目:Kibana を使用する場合はコメント解除して出力先を指定 # Kibana で SSL 有効の場合は証明書に登録したホスト名と合わせる
setup.kibana:
.....
  host: "https://dlp.srv.world:5601"
# 166行目:出力先を指定する # デフォルト出力先は以下のように localhost の Elasticsearch # Logstash に出力する場合はコメントアウトして output.logstash 行関連を有効にする output.elasticsearch: # Array of hosts to connect to.l hosts: ["localhost:9200"] ..... ..... #output.logstash: # The Logstash hosts #hosts: ["localhost:5044"]
[root@dlp ~]#
vi /etc/packetbeat/packetbeat.reference.yml # 1172行目:Kibana を使用する場合はコメント解除して出力先を指定 # Kibana で SSL 有効の場合は ssl 系設定をコメント解除 # 自己署名の SSL 証明書の場合は ssl.verification_mode を none に要変更 setup.kibana: # Kibana Host # Scheme and port can be left out and will be set to the default (http and 5601) # In case you specify and additional path, the scheme is required: http://localhost:5601/path # IPv6 addresses should always be defined as: https://[2001:db8::1]:5601 host: "dlp.srv.world:5601" # Optional protocol and basic auth credentials. protocol: "https" #username: "elastic" #password: "changeme" # Optional HTTP Path #path: "" # Use SSL settings for HTTPS. Default is true. ssl.enabled: true # Configure SSL verification mode. If `none` is configured, all server hosts # and certificates will be accepted. In this mode, SSL based connections are # susceptible to man-in-the-middle attacks. Use only for testing. Default is # `full`. ssl.verification_mode: none[root@dlp ~]# systemctl start packetbeat [root@dlp ~]# systemctl enable packetbeat
|
| [3] | データが取り込まれているか確認しておきます。 |
|
# index 一覧 [root@dlp ~]# curl localhost:9200/_cat/indices?v health status index uuid pri rep docs.count docs.deleted store.size pri.store.size yellow open packetbeat-6.2.1-2... -O8vGFW... 3 1 0 0 230b 230b yellow open sshd_fail-2018.02 ghhQeNG... 5 1 19 0 150.7kb 150.7kb yellow open test_index CIPjYsY... 5 1 1 0 6kb 6kb green open .kibana sV0DskL... 1 0 126 7 339.5kb 339.5kb yellow open metricbeat-6.2.1-2... OhrZTh1... 1 1 22818 0 8.3mb 8.3mb # indexのドキュメント一覧 [root@dlp ~]# curl localhost:9200/packetbeat-6.2.1-2018.02.14/_search?pretty
{
  "took" : 8,
  "timed_out" : false,
  "_shards" : {
    "total" : 3,
    "successful" : 3,
    "skipped" : 0,
    "failed" : 0
  },
  "hits" : {
    "total" : 37,
    "max_score" : 1.0,
    "hits" : [
      {
        "_index" : "packetbeat-6.2.1-2018.02.14",
        "_type" : "doc",
.....
.....
|
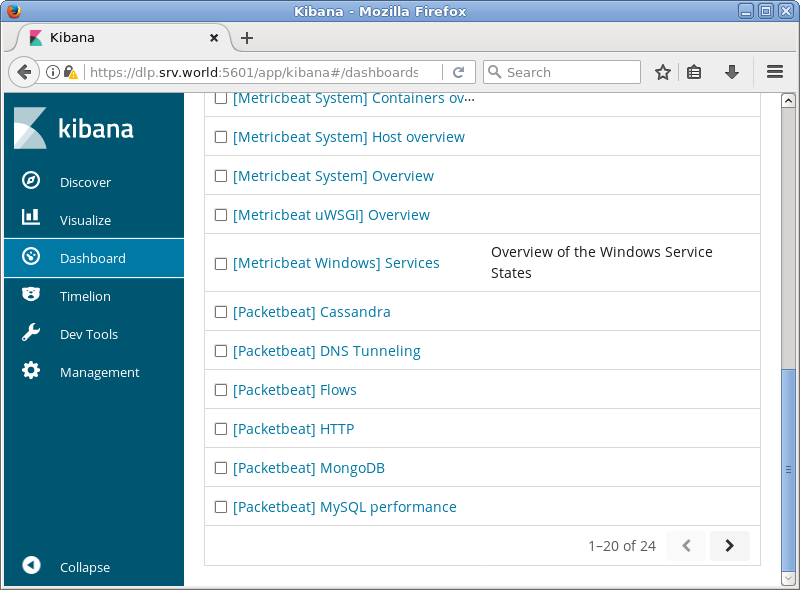
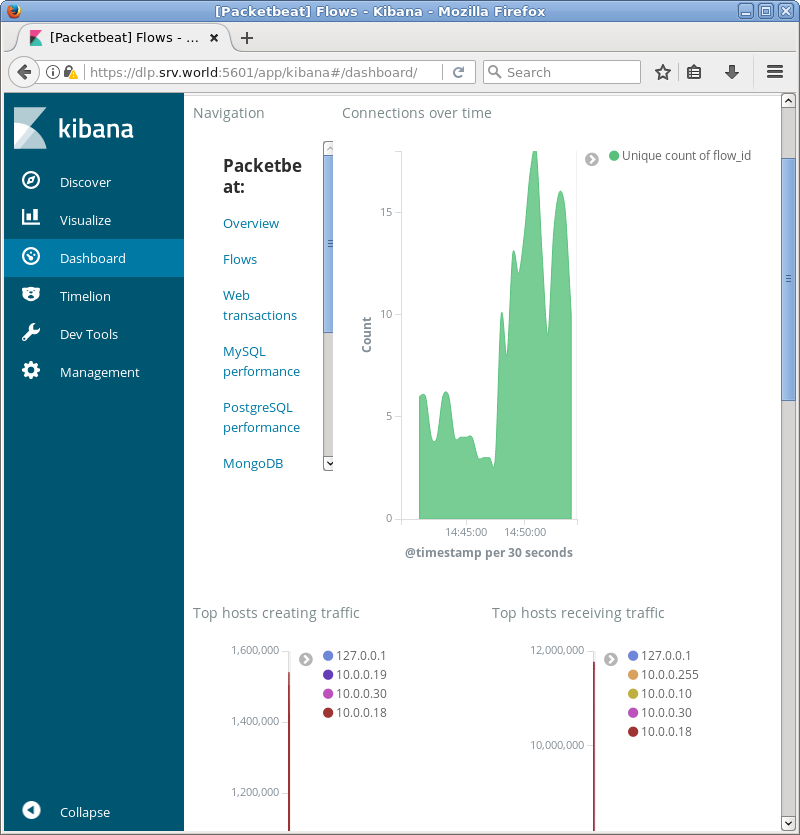
| [4] | Kibana を稼働させている場合は、サンプルダッシュボードへのデータインポートが可能です。 |
|
[root@dlp ~]# packetbeat setup --dashboards Loaded dashboards |
|
|
関連コンテンツ