Elastic Stack 6 : Metricbeat インストール2018/02/12 |
|
CPU やメモリー使用量等のシステム情報のデータ収集機能を提供する Metricbeat をインストールします。
システム情報以外にも、設定により Apache や MySQL のメトリックも収集可能です。詳細は公式サイトを参照ください。
⇒ https://www.elastic.co/guide/en/beats/metricbeat/current/metricbeat-modules.html |
|
| [1] | Metricbeat をインストールします。 事前に Elasticsearch リポジトリ設定済みであることが前提です。 |
|
[root@dlp ~]# yum -y install metricbeat
|
| [2] | 基本的な設定をして Metricbeat を起動します。 |
|
[root@dlp ~]#
vi /etc/metricbeat/metricbeat.yml # 67行目:Kibana を使用する場合はコメント解除して出力先を指定 # Kibana で SSL 有効の場合は証明書に登録したホスト名と合わせる
setup.kibana:
.....
  host: "https://dlp.srv.world:5601"
# 87行目:出力先を指定する # デフォルト出力先は以下のように localhost の Elasticsearch # Logstash に出力する場合はコメントアウトして output.logstash 行関連を有効にする output.elasticsearch: # Array of hosts to connect to. hosts: ["localhost:9200"] ..... ..... #output.logstash: # The Logstash hosts #hosts: ["localhost:5044"]
[root@dlp ~]#
vi /etc/metricbeat/metricbeat.reference.yml # 51行目:収集する項目を設定 # コメントアウト/コメント解除で有効/無効にする
- module: system
  metricsets:
    - cpu             # CPU usage
    - filesystem      # File system usage for each mountpoint
    - fsstat          # File system summary metrics
    - load            # CPU load averages
    - memory          # Memory usage
    - network         # Network IO
    - process         # Per process metrics
    - process_summary # Process summary
    - uptime          # System Uptime
    #- core           # Per CPU core usage
    #- diskio         # Disk IO
    #- socket         # Sockets and connection info (linux only)
# 1172行目:Kibana を使用する場合はコメント解除して出力先を指定 # Kibana で SSL 有効の場合は ssl 系設定をコメント解除 # 自己署名の SSL 証明書の場合は ssl.verification_mode を none に要変更 setup.kibana: # Kibana Host # Scheme and port can be left out and will be set to the default (http and 5601) # In case you specify and additional path, the scheme is required: http://localhost:5601/path # IPv6 addresses should always be defined as: https://[2001:db8::1]:5601 host: "dlp.srv.world:5601" # Optional protocol and basic auth credentials. protocol: "https" #username: "elastic" #password: "changeme" # Optional HTTP Path #path: "" # Use SSL settings for HTTPS. Default is true. ssl.enabled: true # Configure SSL verification mode. If `none` is configured, all server hosts # and certificates will be accepted. In this mode, SSL based connections are # susceptible to man-in-the-middle attacks. Use only for testing. Default is # `full`. ssl.verification_mode: none[root@dlp ~]# systemctl start metricbeat [root@dlp ~]# systemctl enable metricbeat
|
| [3] | データが取り込まれているか確認しておきます。 |
|
# index 一覧 [root@dlp ~]# curl localhost:9200/_cat/indices?v health status index uuid pri rep docs.count docs.deleted store.size pri.store.size yellow open metricbeat-6.2.1-... 1wu4De... 1 1 498 0 219.7kb 219.7kb yellow open sshd_fail-2018.02 8becNs... 5 1 33 0 263.3kb 263.3kb green open .kibana poadDv... 1 0 2 1 11.2kb 11.2kb yellow open test_index ZtKext... 5 1 1 0 6kb 6kb # indexのドキュメント一覧 [root@dlp ~]# curl localhost:9200/metricbeat-6.2.1-2018.02.13/_search?pretty
{
  "took" : 9,
  "timed_out" : false,
  "_shards" : {
    "total" : 1,
    "successful" : 1,
    "skipped" : 0,
    "failed" : 0
  },
  "hits" : {
    "total" : 561,
    "max_score" : 1.0,
    "hits" : [
      {
        "_index" : "metricbeat-6.2.1-2018.02.13",
        "_type" : "doc",
.....
.....
|
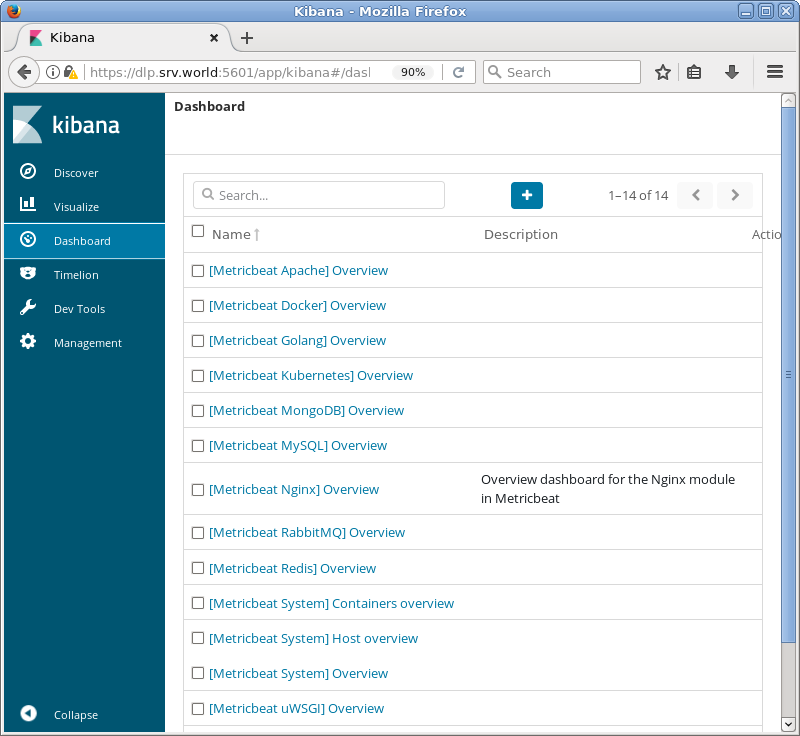
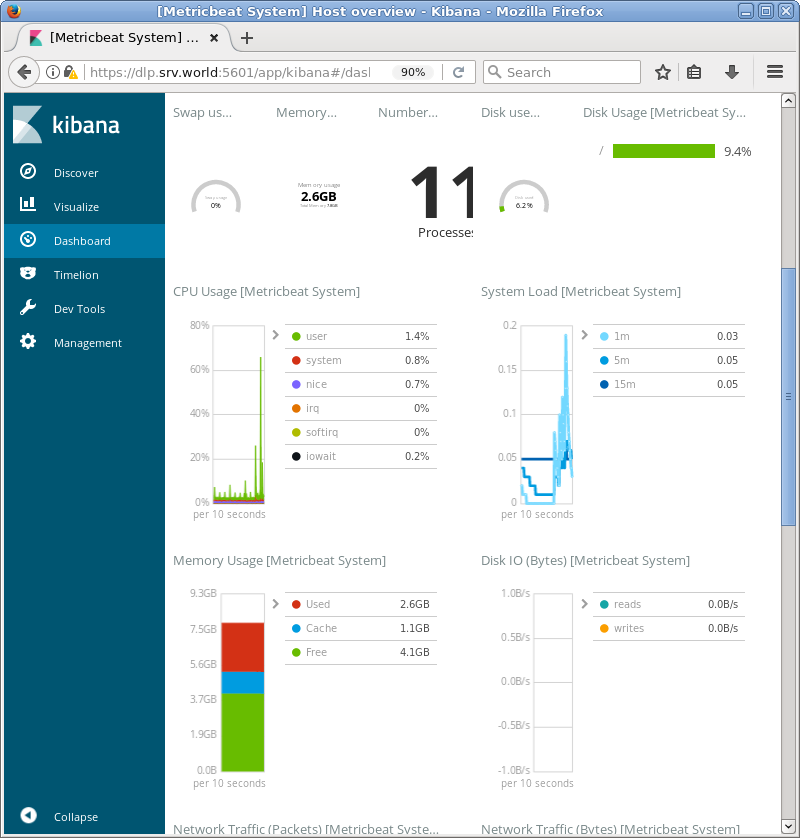
| [4] | Kibana を稼働させている場合は、サンプルダッシュボードへのデータインポートが可能です。 |
|
[root@dlp ~]# metricbeat setup --dashboards Loaded dashboards |
|
|
関連コンテンツ