Elastic Stack 6 : Logstash インストール2018/02/12 |
|
ログの収集や管理機能を提供する Logstash をインストールします。
Logstash の概要や設定ファイルの記述方法等の詳細は Logstash 公式サイトを参照ください。
⇒ https://www.elastic.co/guide/en/logstash/current/index.html |
|
| [1] | Logstash をインストールします。 事前に Elasticsearch リポジトリ設定済みであることが前提です。 |
|
[root@dlp ~]# yum -y install logstash
|
| [2] | ログの収集/保管の設定をして Logstash を起動します。 例として、[/var/log/secure] から sshd への失敗アクセスを取り込むよう設定します。 |
|
[root@dlp ~]#
vi /etc/logstash/conf.d/sshd.conf # 新規作成 # [/var/log/secure] からsshdの失敗アクセスを抽出してelasticsearchのindex [sshd_fail-yyyy.mm]に書き出す
input {
  file {
    type => "seucure_log"
    path => "/var/log/secure"
  }
}
filter {
  grok {
    add_tag => [ "sshd_fail" ]
    match => { "message" => "Failed %{WORD:sshd_auth_type} for %{USERNAME:sshd_invalid_user} from %{IP:sshd_client_ip} port %{NUMBER:sshd_port} %{GREEDYDATA:sshd_protocol}" }
  }
}

output {
  elasticsearch {
    index => "sshd_fail-%{+YYYY.MM}"
  }
}
chgrp logstash /var/log/secure [root@dlp ~]# chmod 640 /var/log/secure [root@dlp ~]# systemctl start logstash [root@dlp ~]# systemctl enable logstash
|
| [3] | 数分経過後、データが取り込まれているか確認しておきます。 |
|
# index 一覧 [root@dlp ~]# curl localhost:9200/_cat/indices?v health status index uuid pri rep docs.count docs.deleted store.size pri.store.size yellow open sshd_fail-2018.02 8becNsB_... 5 1 29 0 193.6kb 193.6kb yellow open test_index ZtKextHO... 5 1 1 0 6kb 6kb # indexのドキュメント一覧 [root@dlp ~]# curl localhost:9200/sshd_fail-2018.02/_search?pretty
{
  "took" : 41,
  "timed_out" : false,
  "_shards" : {
    "total" : 5,
    "successful" : 5,
    "skipped" : 0,
    "failed" : 0
  },
  "hits" : {
    "total" : 29,
    "max_score" : 1.0,
    "hits" : [
      {
        "_index" : "sshd_fail-2018.02",
        "_type" : "doc",
.....
.....
|
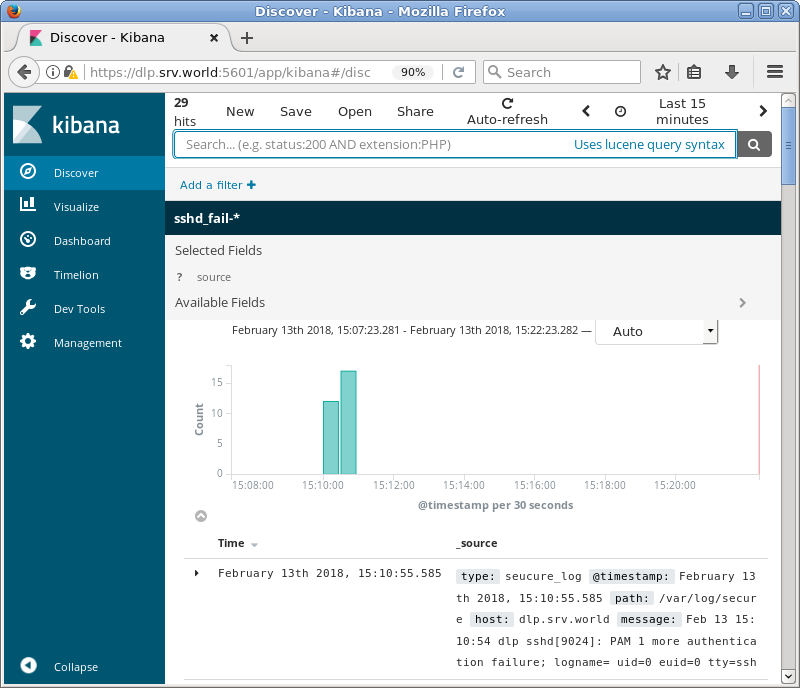
| [4] | Kibana を稼働させている場合は、 Kibana に Index を登録すると、以下のようにデータが取り込まれ、好みの形でグラフ化することもできます。 |
|
関連コンテンツ