root@dlp:~# vi /etc/prometheus/prometheus.yml
.....
.....
scrape_configs:
# The job name is added as a label `job=<job_name>` to any timeseries scraped
from this config.
- job_name: 'prometheus'
# Override the global default and scrape targets from this job every 5 seconn
ds.
scrape_interval: 5s
scrape_timeout: 5s
# metrics_path defaults to '/metrics'
# scheme defaults to 'http'.
static_configs:
- targets: ['localhost:9090']
- job_name: node
# If prometheus-node-exporter is installed, grab stats about the local
# machine by default.
# 44行目 : targets にホストを追加
static_configs:
- targets: ['localhost:9100', 'node01.srv.world:9100']
# または グループを分けたい場合は上例ではなく
# 以下のように [job_name] セクションを追加して設定する
# [job_name] は任意の名前
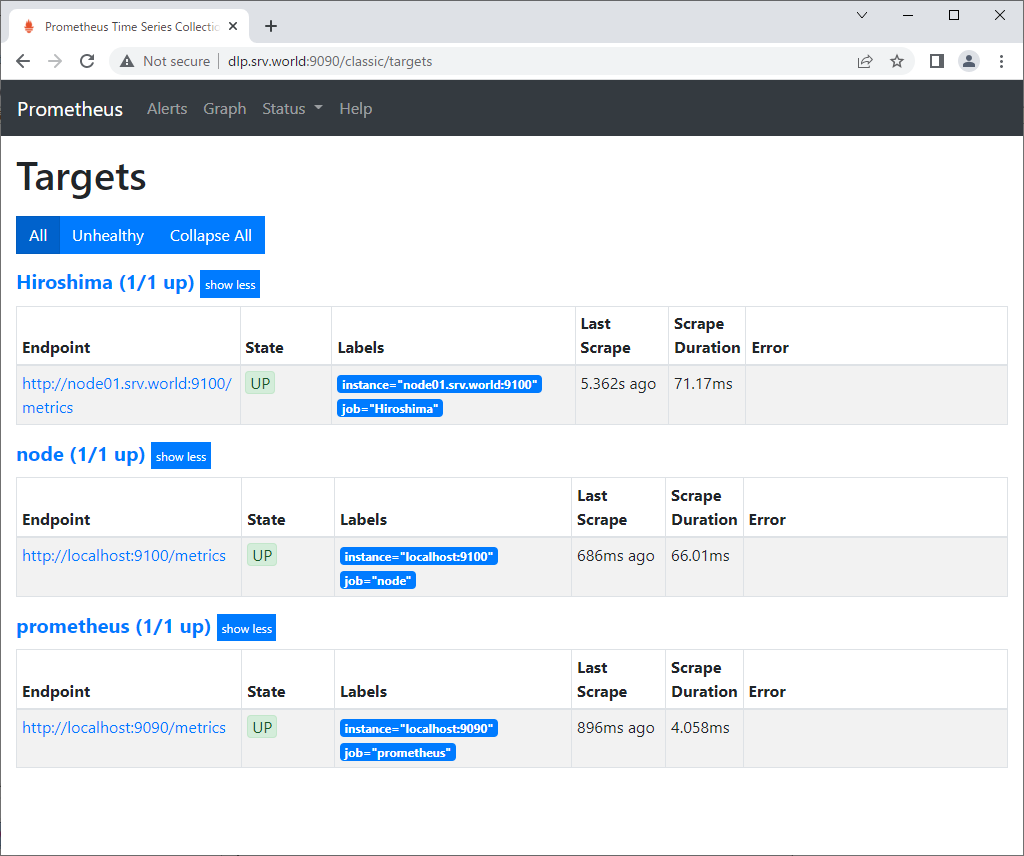
- job_name: Hiroshima
static_configs:
- targets: ['node01.srv.world:9100']
root@dlp:~#
|