Kubernetes : Prometheus でモニタリングする2020/08/25 |
|
Prometheus をインストールして、Kubernetes クラスターの各種メトリクスをモニタリングできるようにします。
当例では以下のような Kubernetes クラスター環境で設定します。
-----------+---------------------------+--------------------------+------------
           |                           |                          |
       eth0|10.0.0.30              eth0|10.0.0.51             eth0|10.0.0.52
+----------+-----------+   +-----------+----------+   +-----------+----------+
|   [ dlp.srv.world ]  |   | [ node01.srv.world ] |   | [ node02.srv.world ] |
|      Master Node     |   |      Worker Node     |   |      Worker Node     |
+----------------------+   +----------------------+   +----------------------+
|
| [1] |
Prometheus が使用する外部ストレージが必要となります。
当例では、こちらの [1], [2], [3] の通り、Master ノード上に NFS サーバーを起動し、[/home/nfsshare] ディレクトリを共有ディレクトリとして設定して、Prometheus が使用するボリュームを動的プロビジョニングできるよう NFS Client Provisioner を設定して進めます。 |
| [2] | Helm で Prometheus チャートをインストールします。 |
|
# Prometheus の設定を書き出して自身の環境用に変更 root@dlp:~# helm inspect values stable/prometheus > prometheus.yaml
root@dlp:~#
vi prometheus.yaml
alertmanager:
.....
.....
    213行目 : コメント解除して使用する storageClass を指定
    storageClass: "nfs-client"
.....
.....
server:
.....
.....
    803行目 : コメント解除して使用する storageClass を指定
    storageClass: "nfs-client"
.....
.....
pushgateway:
.....
.....
    1134行目 : コメント解除して使用する storageClass を指定
    storageClass: "nfs-client"
# Prometheus 用のネームスペース作成 root@dlp:~# kubectl create namespace monitoring namespace/monitoring created helm install prometheus --namespace monitoring -f prometheus.yaml stable/prometheus
NAME: prometheus
LAST DEPLOYED: Tue Aug 24 19:14:04 2020
NAMESPACE: monitoring
STATUS: deployed
REVISION: 1
TEST SUITE: None
NOTES:
The Prometheus server can be accessed via port 80 on the following DNS name from within your cluster:
prometheus-server.monitoring.svc.cluster.local


Get the Prometheus server URL by running these commands in the same shell:
  export POD_NAME=$(kubectl get pods --namespace monitoring -l "app=prometheus,component=server" -o jsonpath="{.items[0].metadata.name}")
  kubectl --namespace monitoring port-forward $POD_NAME 9090


The Prometheus alertmanager can be accessed via port 80 on the following DNS name from within your cluster:
prometheus-alertmanager.monitoring.svc.cluster.local


Get the Alertmanager URL by running these commands in the same shell:
  export POD_NAME=$(kubectl get pods --namespace monitoring -l "app=prometheus,component=alertmanager" -o jsonpath="{.items[0].metadata.name}")
  kubectl --namespace monitoring port-forward $POD_NAME 9093
#################################################################################
######   WARNING: Pod Security Policy has been moved to a global property.  #####
######            use .Values.podSecurityPolicy.enabled with pod-based      #####
######            annotations                                               #####
######            (e.g. .Values.nodeExporter.podSecurityPolicy.annotations) #####
#################################################################################


The Prometheus PushGateway can be accessed via port 9091 on the following DNS name from within your cluster:
prometheus-pushgateway.monitoring.svc.cluster.local


Get the PushGateway URL by running these commands in the same shell:
  export POD_NAME=$(kubectl get pods --namespace monitoring -l "app=prometheus,component=pushgateway" -o jsonpath="{.items[0].metadata.name}")
  kubectl --namespace monitoring port-forward $POD_NAME 9091

For more information on running Prometheus, visit:
https://prometheus.io/
root@dlp:~# kubectl get pods -n monitoring -o wide NAME READY STATUS RESTARTS AGE IP NODE NOMINATED NODE READINESS GATES prometheus-alertmanager-77455866bd-p8t9d 2/2 Running 0 2m12s 10.244.1.23 node01.srv.world <none> <none> prometheus-kube-state-metrics-c65b87574-9rmz6 1/1 Running 0 2m12s 10.244.1.22 node01.srv.world <none> <none> prometheus-node-exporter-rth4v 1/1 Running 0 2m12s 10.0.0.51 node01.srv.world <none> <none> prometheus-node-exporter-z7tbn 1/1 Running 0 2m12s 10.0.0.52 node02.srv.world <none> <none> prometheus-pushgateway-c454fc4-sn6bh 1/1 Running 0 2m12s 10.244.2.15 node02.srv.world <none> <none> prometheus-server-dc6d7575c-5fcjh 2/2 Running 0 2m12s 10.244.2.16 node02.srv.world <none> <none> # もしクラスター外からアクセスする場合はポートフォワード root@dlp:~# kubectl port-forward -n monitoring service/prometheus-server --address 0.0.0.0 9090:80 |
| [3] | Granafa もインストールする場合は、同様にインストール可能です。 |
|
# 設定を書き出して storageClassName を変更 root@dlp:~# helm inspect values stable/grafana > grafana.yaml
root@dlp:~#
vi grafana.yaml 215行目 : [persistence] を有効にする 216行目 : コメント解除して自身の [storageClass] を指定 persistence: type: pvc enabled: true storageClassName: nfs-clientroot@dlp:~# helm install grafana --namespace monitoring -f grafana.yaml stable/grafana
NAME: grafana
LAST DEPLOYED: Tue Aug 24 19:33:46 2020
NAMESPACE: monitoring
STATUS: deployed
REVISION: 1
NOTES:
1. Get your 'admin' user password by running:

   kubectl get secret --namespace monitoring grafana -o jsonpath="{.data.admin-password}" | base64 --decode ; echo

2. The Grafana server can be accessed via port 80 on the following DNS name from within your cluster:

   grafana.monitoring.svc.cluster.local

   Get the Grafana URL to visit by running these commands in the same shell:

     export POD_NAME=$(kubectl get pods --namespace monitoring -l "app.kubernetes.io/name=grafana,app.kubernetes.io/instance=grafana" -o jsonpath="{.items[0].metadata.name}")
     kubectl --namespace monitoring port-forward $POD_NAME 3000

3. Login with the password from step 1 and the username: admin
root@dlp:~# kubectl get pods -n monitoring NAME READY STATUS RESTARTS AGE grafana-7b6499754f-74786 1/1 Running 0 41s ..... ..... # もしクラスター外からアクセスする場合はポートフォワード root@dlp:~# kubectl port-forward -n monitoring service/grafana --address 0.0.0.0 3000:80 |
| [4] |
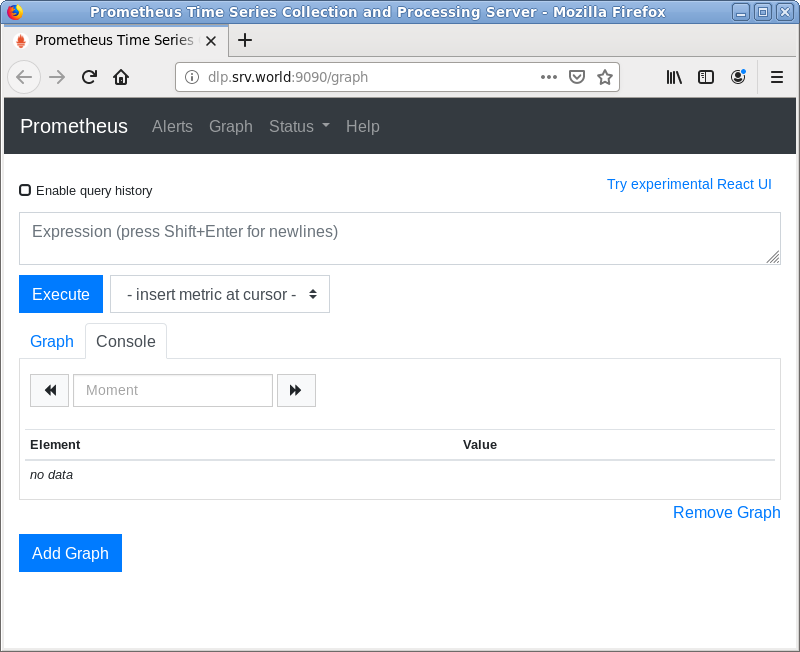
クラスタ―内ホストから Prometheus UI にアクセスする場合は Web ブラウザーを起動して、以下の URL にアクセスします。
⇒ http://prometheus-server.monitoring.svc.cluster.local
ポートフォワーディングした場合は、ローカルネットワーク内の任意のコンピューターで Web ブラウザーを起動して、以下の URL にアクセスします。
⇒ http://(Master ノードのホスト名 または IP アドレス):(設定したポート)/
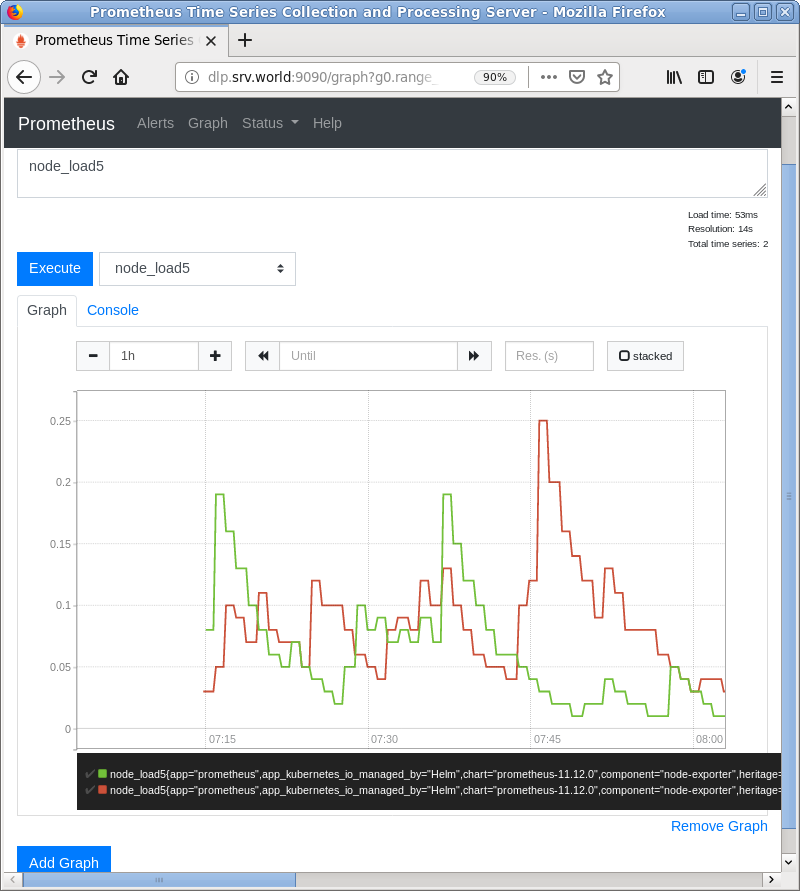
以下のように Prometheus UI が表示されれば OK です。
|
|
|
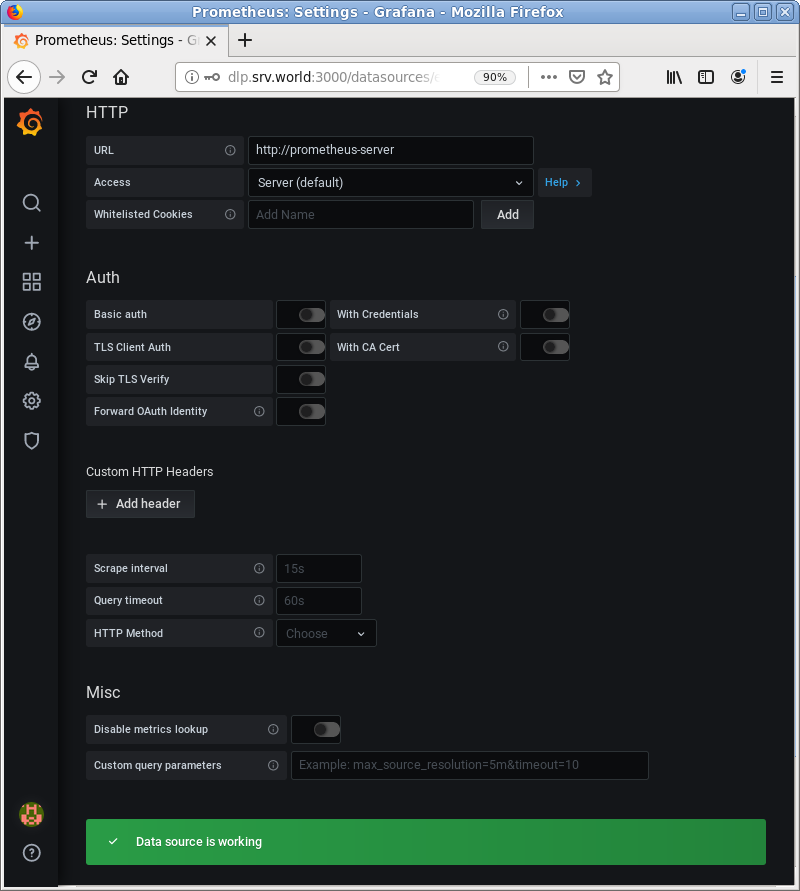
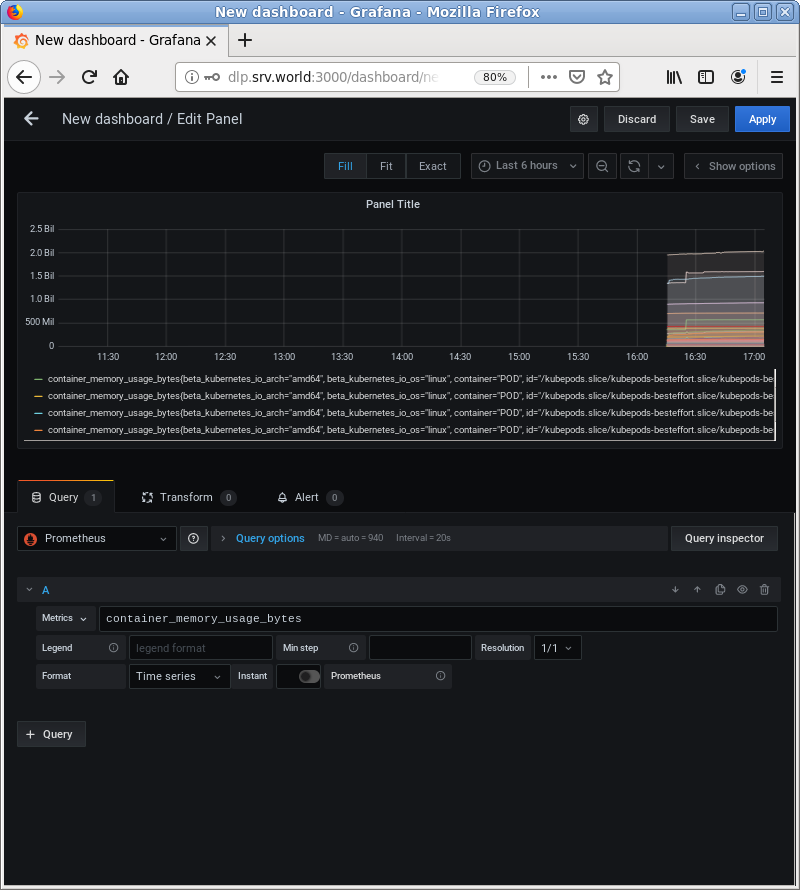
| [5] |
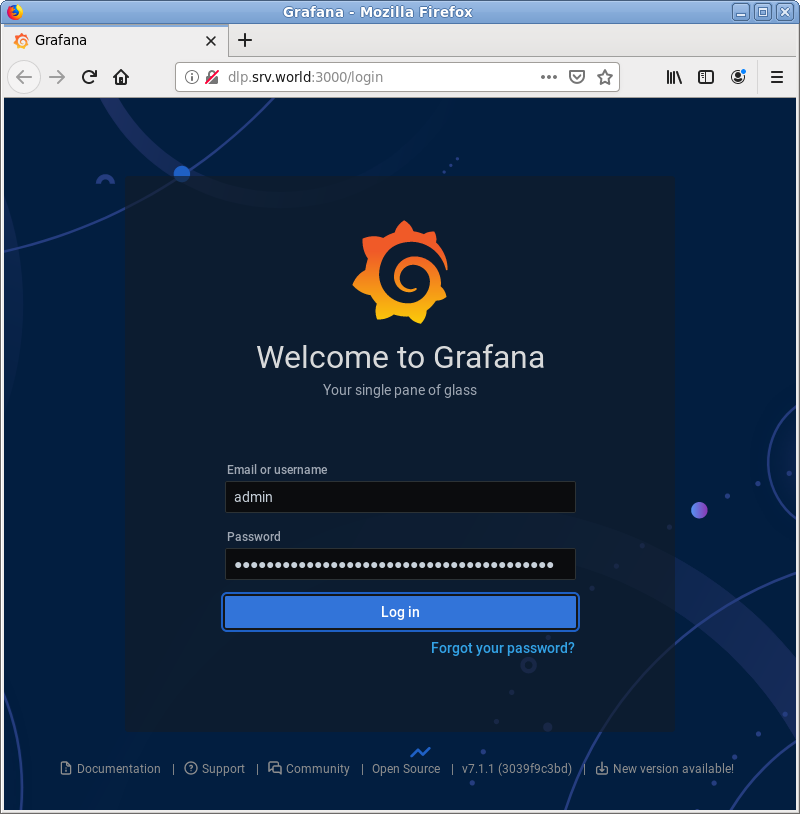
クラスタ―内ホストから Granafa にアクセスする場合は Web ブラウザーを起動して、以下の URL にアクセスします。
⇒ http://grafana.monitoring.svc.cluster.local
ポートフォワーディングした場合は、ローカルネットワーク内の任意のコンピューターで Web ブラウザーを起動して、以下の URL にアクセスします。
⇒ http://(Master ノードのホスト名 または IP アドレス):(設定したポート)/
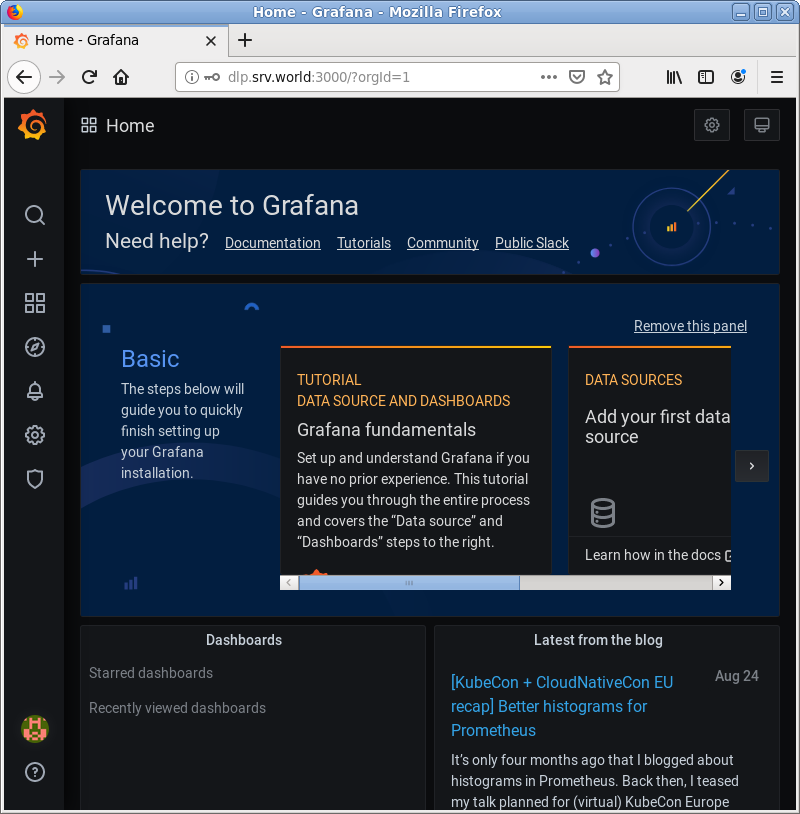
以下のように Granafa が表示されれば OK です。
[admin] パスワードは以下のコマンドで確認します。⇒ kubectl get secret --namespace monitoring grafana -o jsonpath="{.data.admin-password}" | base64 --decode ; echo |
|
|
|
|
関連コンテンツ