Elastic Stack 8 : Auditbeat インストール2023/08/04 |
|
監査アクションの監視機能を提供する Auditbeat をインストールします。 |
|
| [1] | Auditbeat をインストールします。 事前に Elasticsearch リポジトリ設定済みであることが前提です。 |
|
root@dlp:~# apt -y install auditbeat
|
| [2] | 基本的な設定をして Auditbeat を起動します。 |
|
root@dlp:~#
vi /etc/auditbeat/auditbeat.yml # 13行目 : 監査アクションの設定 (書式は auditctl と同じ)
- module: auditd
  audit_rules: |
    ## Define audit rules here.
    ## Create file watches (-w) or syscall audits (-a or -A). Uncomment these
    ## examples or add your own rules.

    ## If you are on a 64 bit platform, everything should be running
    ## in 64 bit mode. This rule will detect any use of the 32 bit syscalls
    ## because this might be a sign of someone exploiting a hole in the 32
    ## bit API.
    #-a always,exit -F arch=b32 -S all -F key=32bit-abi

    ## Executions.
    #-a always,exit -F arch=b64 -S execve,execveat -k exec

    ## External access (warning: these can be expensive to audit).
    #-a always,exit -F arch=b64 -S accept,bind,connect -F key=external-access

    ## Identity changes.
    #-w /etc/group -p wa -k identity
    #-w /etc/passwd -p wa -k identity
    #-w /etc/gshadow -p wa -k identity

.....
.....
# 122行目 : Kibana を使用する場合はコメント解除して出力先を指定 # Kibana で SSL 有効の場合は証明書に登録したホスト名と合わせる # [username], [password] は管理ユーザーのユーザー名とパスワード # 自己署名の証明書を使用している場合は [ssl.verification_mode: none] setup.kibana: ..... host: "https://dlp.srv.world:5601" protocol: "https" username: "elastic" password: "password" ssl.enabled: true ssl.verification_mode: none # 154行目 : Elasticsearch の出力先を指定する # [username], [password] は管理ユーザーのユーザー名とパスワード # [ssl.certificate_authorities] は Elasticsearch で生成された cacert output.elasticsearch: # Array of hosts to connect to. hosts: ["https://dlp.srv.world:9200"] protocol: "https" username: "elastic" password: "password" ssl.certificate_authorities: "/etc/elasticsearch/certs/http_ca.crt" ..... .....
root@dlp:~#
vi /etc/auditbeat/auditbeat.reference.yml # 34行目 : auditd モジュールの基本設定 - module: auditd resolve_ids: true failure_mode: silent backlog_limit: 8196 rate_limit: 0 include_raw_message: false include_warnings: false audit_rules: | ..... ..... # 1406行目 : Kibana を使用する場合はコメント解除して出力先を指定 # Kibana で SSL 有効の場合は ssl 系設定をコメント解除 # [username], [password] は管理ユーザーのユーザー名とパスワード # 自己署名の証明書を使用している場合は [ssl.verification_mode: none] setup.kibana: # Kibana Host # Scheme and port can be left out and will be set to the default (http and 5601) # In case you specify and additional path, the scheme is required: http://localhost:5601/path # IPv6 addresses should always be defined as: https://[2001:db8::1]:5601 host: "https://dlp.srv.world:5601" # Optional protocol and basic auth credentials. protocol: "https" username: "elastic" password: "password" # Optional HTTP Path #path: "" # Use SSL settings for HTTPS. Default is true. ssl.enabled: true ..... ..... # after very careful consideration. It is primarily intended as a temporary # diagnostic mechanism when attempting to resolve TLS errors; its use in # production environments is strongly discouraged. # The default value is full. ssl.verification_mode: noneroot@dlp:~# systemctl enable --now auditbeat
|
| [3] | データが取り込まれているか確認しておきます。 |
|
# index 一覧 root@dlp:~# curl -u elastic --cacert /etc/elasticsearch/certs/http_ca.crt https://127.0.0.1:9200/_cat/indices?v health status index uuid pri rep docs.count docs.deleted store.size pri.store.size green open .internal.alerts-observability.metrics.alerts-default-000001 JG7OkJGSQoOU1unZWIpPhg 1 0 0 0 247b 247b yellow open .ds-auditbeat-8.9.0-2023.08.04-000001 ybyFPLpJSmSFuZLl0HLfYA 1 1 1543 0 823.9kb 823.9kb yellow open .ds-metricbeat-8.9.0-2023.08.04-000001 _P5TRkvkRQajH-_vCoSxPg 1 1 4334 0 8.9mb 8.9mb green open .internal.alerts-observability.logs.alerts-default-000001 7-mTfD30Qsm_BMQrjWf4wA 1 0 0 0 247b 247b green open .internal.alerts-observability.uptime.alerts-default-000001 5T9PMMMiRkCgUy9SIzj1Mg 1 0 0 0 247b 247b green open .fleet-file-data-agent-000001 g9lX3CKhRVOHtUIQBOYrUw 1 0 0 0 247b 247b green open .fleet-files-agent-000001 9jPGD7QJRXKygS-7h_KsRw 1 0 0 0 247b 247b green open .internal.alerts-security.alerts-default-000001 mx-yDAa7QBmOH0Hqg-ewpg 1 0 0 0 247b 247b green open .internal.alerts-observability.slo.alerts-default-000001 oD35AVTPStG-77Ot13aXJQ 1 0 0 0 247b 247b green open .internal.alerts-observability.apm.alerts-default-000001 ItO4YBEvTYqIV4EM871jDg 1 0 0 0 247b 247b yellow open test_index yW_f_CXpSU6uAqRNpHXyTw 1 1 1 0 6.4kb 6.4kb yellow open .ds-packetbeat-8.9.0-2023.08.04-000001 2naLXq6rTHapYqnMwBQmpQ 1 1 6682 0 5.4mb 5.4mb # index のドキュメント一覧 root@dlp:~# curl -u elastic --cacert /etc/elasticsearch/certs/http_ca.crt https://127.0.0.1:9200/.ds-auditbeat-8.9.0-2023.08.04-000001/_search?pretty
{
  "took" : 1,
  "timed_out" : false,
  "_shards" : {
    "total" : 1,
    "successful" : 1,
    "skipped" : 0,
    "failed" : 0
  },
  "hits" : {
    "total" : {
      "value" : 1572,
      "relation" : "eq"
    },
    "max_score" : 1.0,
    "hits" : [
      {
        "_index" : ".ds-auditbeat-8.9.0-2023.08.04-000001",
        "_id" : "c_0ovokB_raRHX1gWXSu",
        "_score" : 1.0,
        "_source" : {
          "@timestamp" : "2023-08-04T01:27:41.765Z",
          "group" : {
            "id" : "110",
            "name" : "kibana"
          },
          "agent" : {
            "ephemeral_id" : "fe5a6ccf-f460-4dbd-bffd-dd3f1171cbbd",
            "id" : "1fec2ad3-01fa-4759-a17f-689432eb1666",
            "name" : "dlp.srv.world",
            "type" : "auditbeat",
            "version" : "8.9.0"
          },
          "system" : {
            "audit" : {
              "socket" : {
                "gid" : 110,
                "euid" : 103,
                "egid" : 110,
                "kernel_sock_address" : "0xff2c3ca18f47abc0",
                "uid" : 103
              }
            }
          },
.....
.....
|
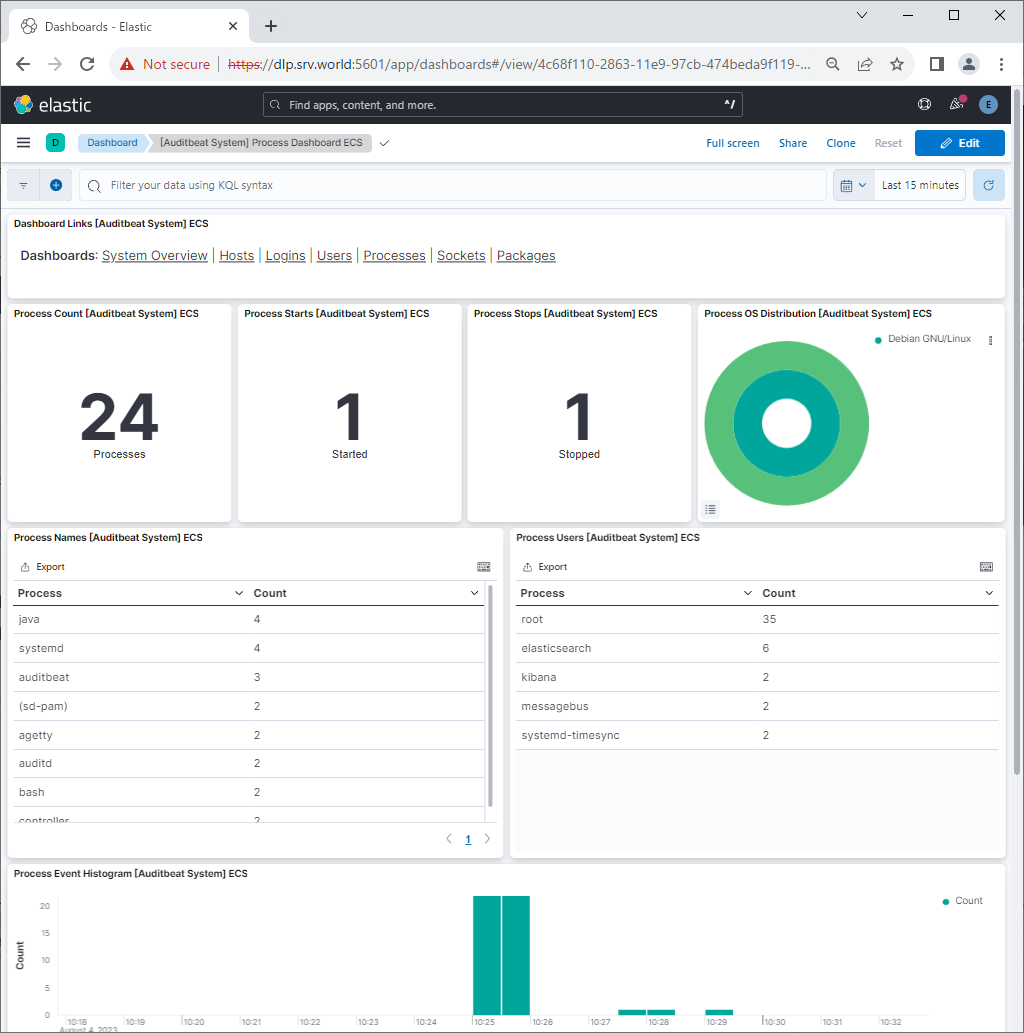
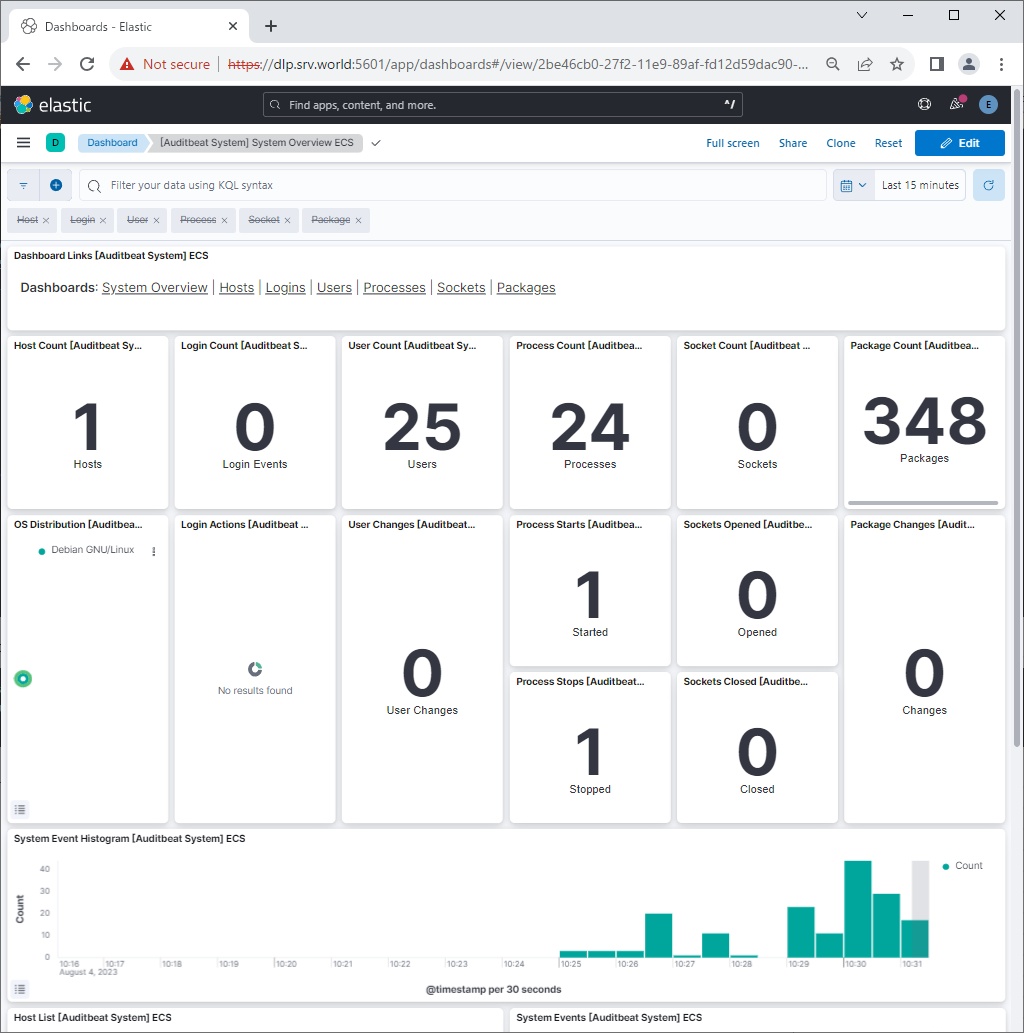
| [4] | Kibana を稼働させている場合は、サンプルダッシュボードへのデータインポートが可能です。 |
|
root@dlp:~# auditbeat setup --dashboards Loading dashboards (Kibana must be running and reachable) Loaded dashboards |
|
|
関連コンテンツ