Prometheus : インストール2020/07/17 |
|
監視システム Prometheus をインストールして設定します。
Prometheus サーバーから監視対象ノードにアクセスしてデータを取得する Pull 型のアーキテクチャーを採用しています。 また、外部データベースは不要で Prometheus サーバー上に時系列データが保存されます。
Prometheus のアーキテクチャー概要は公式サイトを参照ください。
⇒ https://prometheus.io/docs/introduction/overview/ |
|
| [1] | Prometheus のリポジトリを設定してインストールします。 Prometheus サーバー、および CPU やメモリーなどの一般的なシステムリソースのデータを取得する [node-exporter] をインストールします。 |
[root@dlp ~]# cat > /etc/yum.repos.d/prometheus.repo <<'EOF'
[prometheus]
name=prometheus
baseurl=https://packagecloud.io/prometheus-rpm/release/el/$releasever/$basearch
repo_gpgcheck=1
enabled=1
gpgkey=https://packagecloud.io/prometheus-rpm/release/gpgkey
       https://raw.githubusercontent.com/lest/prometheus-rpm/master/RPM-GPG-KEY-prometheus-rpm
gpgcheck=1
metadata_expire=300
EOF
[root@dlp ~]# dnf -y install prometheus2 node_exporter
|
| [2] | 基本的な設定は [prometheus.yml] で実施します。 |
|
# 基本的な設定は下記ファイルで実施 # 変更なしのデフォルト状態でも [Prometheus] 関連の統計情報は取得される [root@dlp ~]# vi /etc/prometheus/prometheus.yml
# my global config
global:
  scrape_interval:     15s # Set the scrape interval to every 15 seconds. Default is every 1 minute.
  evaluation_interval: 15s # Evaluate rules every 15 seconds. The default is every 1 minute.
  # scrape_timeout is set to the global default (10s).

# Alertmanager configuration
alerting:
  alertmanagers:
  - static_configs:
    - targets:
      # - alertmanager:9093

# Load rules once and periodically evaluate them according to the global 'evaluation_interval'.
rule_files:
  # - "first_rules.yml"
  # - "second_rules.yml"

# A scrape configuration containing exactly one endpoint to scrape:
# Here it's Prometheus itself.
scrape_configs:
  # The job name is added as a label `job=<job_name>` to any timeseries scraped from this config.
  - job_name: 'prometheus'

    # metrics_path defaults to '/metrics'
    # scheme defaults to 'http'.

    static_configs:
    - targets: ['localhost:9090']

  # 追記 : [node-exporter] によるシステム関連の統計情報を取得
  - job_name: node
    static_configs:
      - targets: ['localhost:9100']
[root@dlp ~]# systemctl enable --now prometheus node_exporter
|
| [3] | Firewalld を有効にしている場合は、サービスの許可が必要です。 |
|
[root@dlp ~]# firewall-cmd --add-service=prometheus --permanent success [root@dlp ~]# firewall-cmd --reload success |
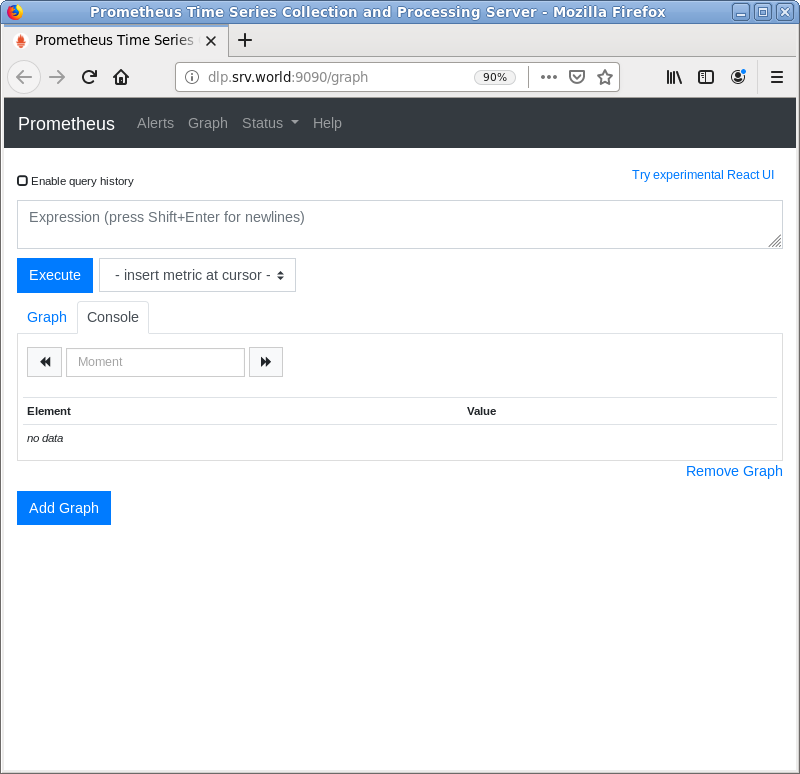
| [4] | 任意のクライアントホストで Web ブラウザーを起動し、[http://(サーバーのホスト名 または IPアドレス):9090/] へアクセスします。 すると、Prometheus Web UI の画面が表示されます。 |
|
| [5] |
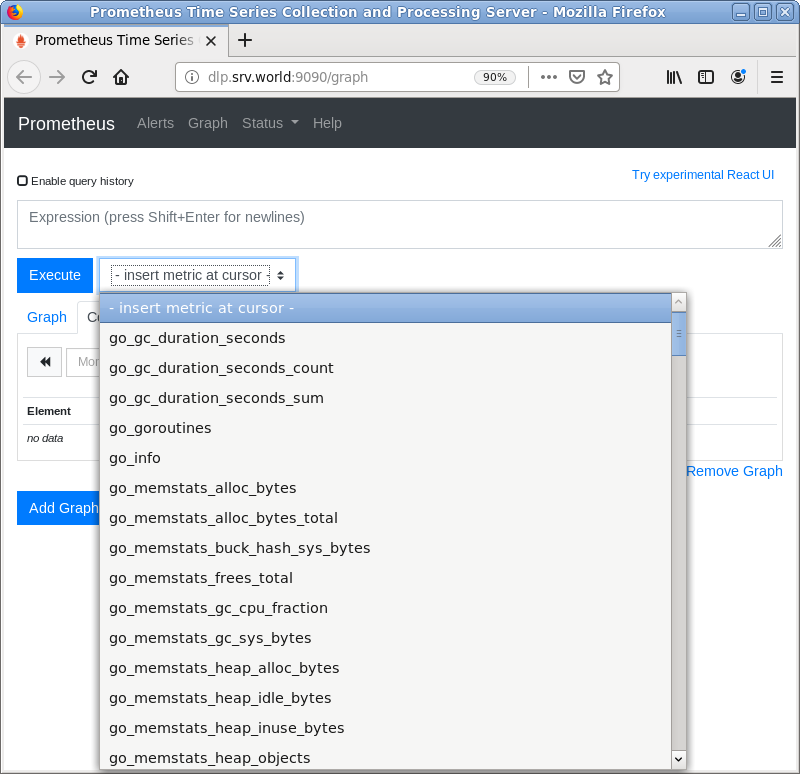
[insert metric at cursor] をクリックすると、保存された時系列データが参照可能な様々なクエリーが用意されています。
クエリーは上部の入力フィールドから直接記述することも可能で、Prometheus 独自の [Expression Language] 機能です。
Expression Language の使用例は公式サイトを参照ください。⇒ https://prometheus.io/docs/querying/examples/ |
|
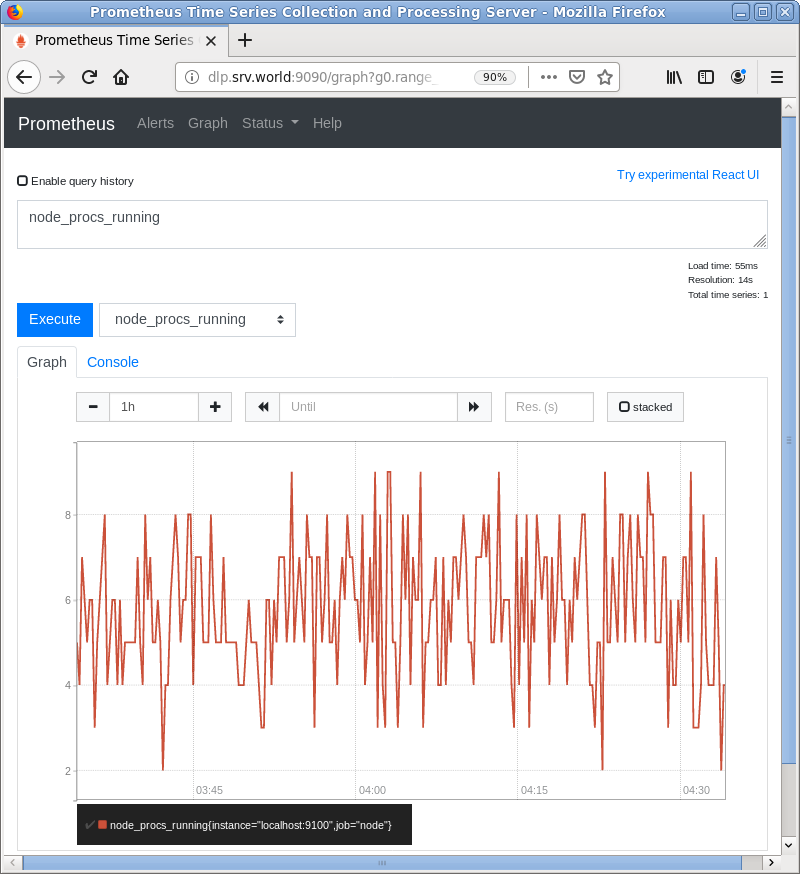
| [6] | [node-exporter] で取得した [node_procs_running] のデータを表示した様子です。 |
|
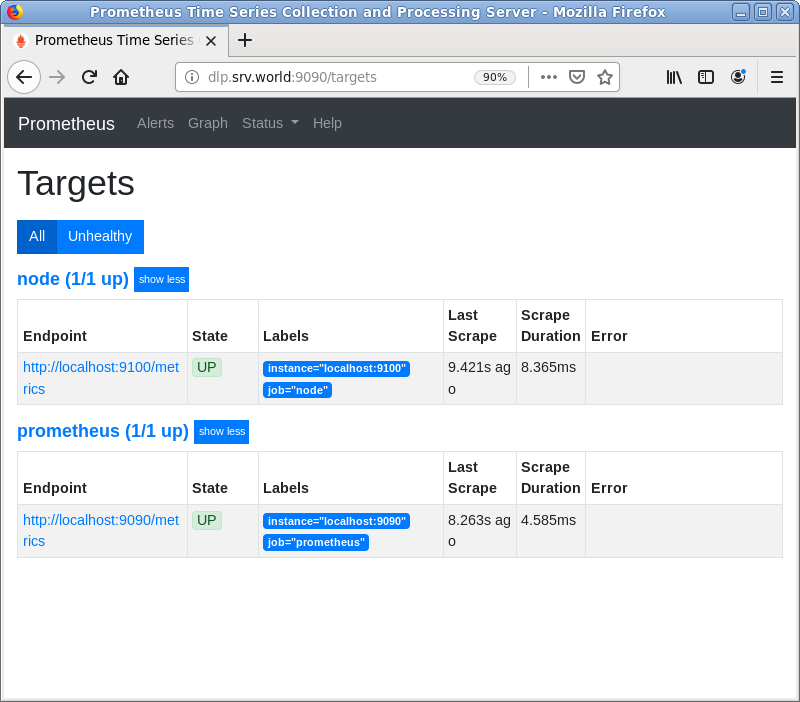
| [7] | [Status] - [Targets] をクリックすると、各ノードのステータスが確認できます。 |
|
関連コンテンツ