Elastic Stack 6 : X-Pack インストール2018/02/25 |
|
Elasticsearch や Kibana の機能を拡張できるプラグインパッケージ X-Pack をインストールします。
X-Pack に含まれるプラグインはほとんどが有償のため、継続して利用するにはライセンスの購入が必要です。
ただし、30日間は機能制限なしで試用可能なトライアルライセンスが用意されています。
サブスクリプションの詳細は下記を参照ください。
⇒ https://www.elastic.co/subscriptions |
|
| [1] | Elasticsearch が稼働する全ノードで Elasticsearch 用の X-Pack をインストールします。 |
|
[root@dlp ~]# /usr/share/elasticsearch/bin/elasticsearch-plugin install x-pack -> Downloading x-pack from elastic [=================================================] 100% @@@@@@@@@@@@@@@@@@@@@@@@@@@@@@@@@@@@@@@@@@@@@@@@@@@@@@@@@@@ @ WARNING: plugin requires additional permissions @ @@@@@@@@@@@@@@@@@@@@@@@@@@@@@@@@@@@@@@@@@@@@@@@@@@@@@@@@@@@ * java.io.FilePermission \\.\pipe\* read,write * java.lang.RuntimePermission accessClassInPackage.com.sun.activation.registries * java.lang.RuntimePermission getClassLoader * java.lang.RuntimePermission setContextClassLoader * java.lang.RuntimePermission setFactory * java.net.SocketPermission * connect,accept,resolve * java.security.SecurityPermission createPolicy.JavaPolicy * java.security.SecurityPermission getPolicy * java.security.SecurityPermission putProviderProperty.BC * java.security.SecurityPermission setPolicy * java.util.PropertyPermission * read,write See http://docs.oracle.com/javase/8/docs/technotes/guides/security/permissions.html for descriptions of what these permissions allow and the associated risks. Continue with installation? [y/N] y @@@@@@@@@@@@@@@@@@@@@@@@@@@@@@@@@@@@@@@@@@@@@@@@@@@@@@@@@@@ @ WARNING: plugin forks a native controller @ @@@@@@@@@@@@@@@@@@@@@@@@@@@@@@@@@@@@@@@@@@@@@@@@@@@@@@@@@@@ This plugin launches a native controller that is not subject to the Java security manager nor to system call filters. Continue with installation? [y/N] y Elasticsearch keystore is required by plugin [x-pack-security], creating... -> Installed x-pack with: x-pack-core,x-pack-deprecation,x-pack-graph,x-pack-logstash, x-pack-ml,x-pack-monitoring,x-pack-security,x-pack-upgrade,x-pack-watcher |
| [2] | Kibana をインストールしている場合は、Kibana 稼働ノードで Kibana 用の X-Pack をインストールします。 |
|
[root@dlp ~]# /usr/share/kibana/bin/kibana-plugin install x-pack Attempting to transfer from x-pack Attempting to transfer from https://artifacts.elastic.co/downloads/kibana-plugins/x-pack/x-pack-6.2.2.zip Transferring 269704442 bytes.................... Transfer complete Retrieving metadata from plugin archive Extracting plugin archive Extraction complete Optimizing and caching browser bundles... Plugin installation complete |
| [3] | Logstash をインストールしている場合は、Logstash 稼働ノードで Logstash 用の X-Pack をインストールします。 |
|
[root@dlp ~]# /usr/share/logstash/bin/logstash-plugin install x-pack Downloading file: https://artifacts.elastic.co/downloads/logstash-plugins/x-pack/x-pack-6.2.2.zip Downloading [=============================================================] 100% Installing file: /tmp/studtmp-af3a51070a5bcce6ebfde84d3cca4bd4953756ae71755e99101218e6ac0d/x-pack-6.2.2.zip Install successful |
| [4] | X-Pack の設定です。Elasticsearch が稼働する全ノードで同様の設定をします。 当例では一旦 Security などの機能は無効な設定とします。Security 等を有効化する場合は次頁以降を参照ください。 X-Pack の機能別、プロダクト別の設定可否は公式サイトで確認できます。 ⇒ https://www.elastic.co/guide/en/elasticsearch/reference/6.2/settings-xpack.html |
|
[root@dlp ~]#
vi /etc/elasticsearch/elasticsearch.yml # 最終行に追記 # ライセンスの定義 (下例はトライアルライセンス) xpack.license.self_generated.type: trial # Monitoring の設定 (有効) xpack.monitoring.enabled: true # Security の設定 (無効) xpack.security.enabled: false # Watcher の設定 (無効) xpack.watcher.enabled: false # Machine learning の設定 (無効) xpack.ml.enabled: false
[root@dlp ~]#
systemctl restart elasticsearch kibana logstash # index 一覧を確認すると Monitoring のデータが取得されている [root@dlp ~]# curl localhost:9200/_cat/indices?v health status index uuid pri rep docs.count docs.deleted store.size ... green open test_index VfIZnk... 5 1 1 0 12.3kb ... green open .monitoring-logstash-6-2018.02.23 -AXqna... 1 1 806 0 209.3kb ... green open .monitoring-kibana-6-2018.02.25 itNQ-g... 1 1 76 0 137.4kb ... green open .monitoring-es-6-2018.02.23 CiewsT... 1 1 4082 52 4.9mb ... green open sshd_fail-2018.02 1KDc16... 5 1 23 0 329.8kb ... green open .monitoring-es-6-2018.02.25 w9Fm71... 1 1 1075 32 1.7mb ... green open .monitoring-logstash-6-2018.02.25 9JqBNG... 1 1 534 0 274.7kb ... green open .monitoring-kibana-6-2018.02.23 hnxoh-... 1 1 110 0 112.4kb ... |
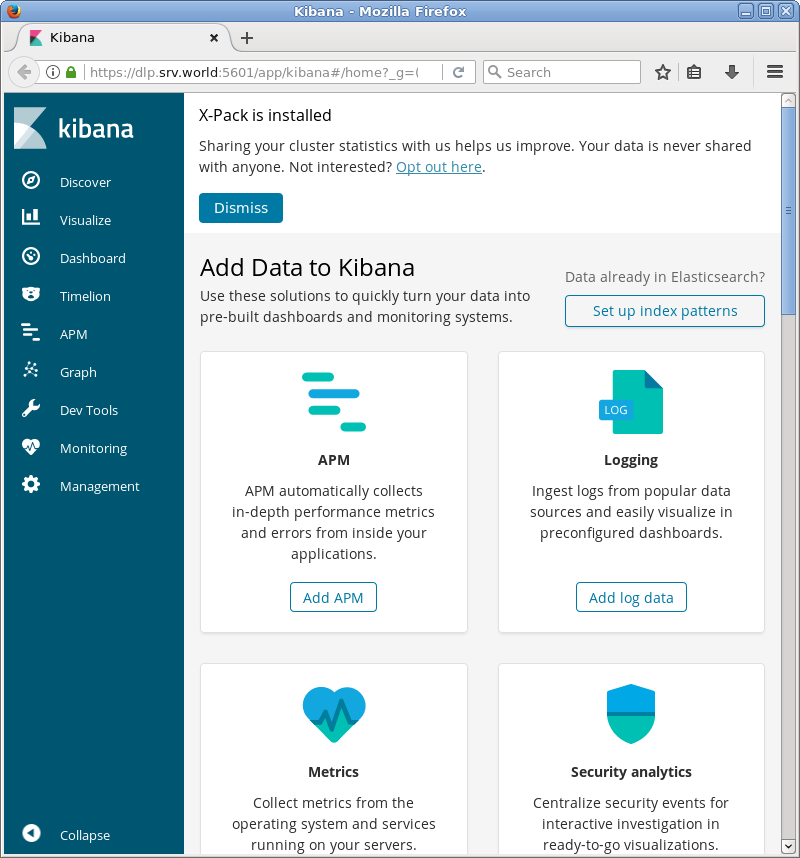
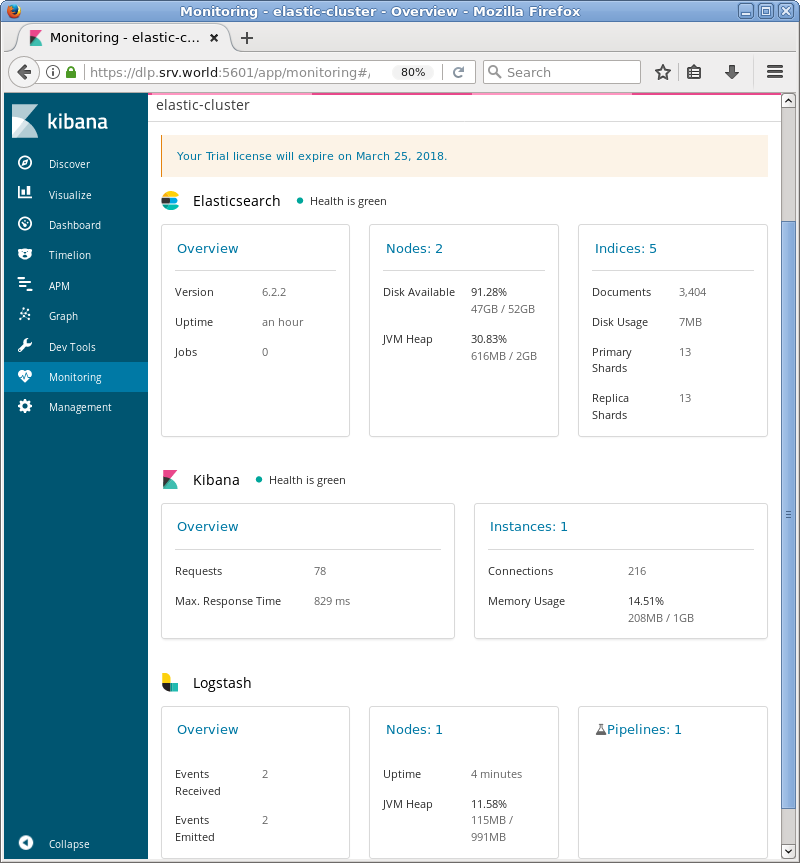
| [5] | Kibana を稼働させている場合、ダッシュボードにアクセスすると、Monitoring のデータが確認できます。 |
|
|
関連コンテンツ