Elastic Stack 7 : Install Metricbeat2021/06/22 |
|
Install Metricbeat that collects metrics from System or Services.
For Metricbeat details, refer to the official site.
⇒ https://www.elastic.co/guide/en/beats/metricbeat/current/metricbeat-modules.html |
|
| [1] | Install Metricbeat. Configure Elasticsearch repository before it. |
|
[root@dlp ~]# dnf -y install metricbeat
|
| [2] | Configure basic settings and start Metricbeat. |
|
[root@dlp ~]#
vi /etc/metricbeat/metricbeat.yml # line 67 : if use Kibana, uncomment and specify output host # if SSL is enabled on Kibana, hostname should be the same with the hostname in certs
setup.kibana:
.....
  host: "https://dlp.srv.world:5601"
# line 92 : specify output host # the default is localhost's Elasticsearch # if output to Logstash, comment out Elasticsearch and uncomment logstash lines output.elasticsearch: # Array of hosts to connect to. hosts: ["localhost:9200"] ..... ..... #output.logstash: # The Logstash hosts #hosts: ["localhost:5044"]
[root@dlp ~]#
vi /etc/metricbeat/metricbeat.reference.yml # line 61 : set items to collect data # enable and disable to comment out and uncomment
- module: system
  metricsets:
    - cpu             # CPU usage
    - load            # CPU load averages
    - memory          # Memory usage
    - network         # Network IO
    - process         # Per process metrics
    - process_summary # Process summary
    - uptime          # System Uptime
    - socket_summary  # Socket summary
    #- core           # Per CPU core usage
    #- diskio         # Disk IO
    #- filesystem     # File system usage for each mountpoint
    #- fsstat         # File system summary metrics
    #- raid           # Raid
    #- socket         # Sockets and connection info (linux only)
    #- service        # systemd service information
  enabled: true
  period: 10s
  processes: ['.*']
# line 2595 : if use Kibana, uncomment and specify output host # if SSL is enabled on Kibana, uncomment ssl related lines # if your certs is self-siged one, ssl.verification_mode should be [none] setup.kibana: # Kibana Host # Scheme and port can be left out and will be set to the default (http and 5601) # In case you specify and additional path, the scheme is required: http://localhost:5601/path # IPv6 addresses should always be defined as: https://[2001:db8::1]:5601 host: "dlp.srv.world:5601" # Optional protocol and basic auth credentials. protocol: "https" #username: "elastic" #password: "changeme" # Optional HTTP path #path: "" # Optional Kibana space ID. #space.id: "" # Use SSL settings for HTTPS. ssl.enabled: true ..... ..... # after very careful consideration. It is primarily intended as a temporary # diagnostic mechanism when attempting to resolve TLS errors; its use in # production environments is strongly discouraged. # The default value is full. ssl.verification_mode: none[root@dlp ~]# systemctl enable --now metricbeat
|
| [3] | Verify status the data has been collected normally. |
|
# index list [root@dlp ~]# curl localhost:9200/_cat/indices?v health status index uuid pri rep docs.count docs.deleted store.size pri.store.size green open .kibana_7.13.2_001 zA_r0rrjT7OMUMVSGmRVfg 1 0 23 25 2.1mb 2.1mb green open .apm-custom-link d1-9Pkn-RXOu_qhMOanvVA 1 0 0 0 208b 208b green open .kibana-event-log-7.13.2-000001 Y-rCmM6yTBKa9W5H1LeJ1g 1 0 1 0 5.6kb 5.6kb green open .apm-agent-configuration y3hQme2SQpGMtb64NLsNdA 1 0 0 0 208b 208b green open .async-search WRLoMwCITRKD3C_BrFJ9bw 1 0 0 1 3.3kb 3.3kb green open .kibana_task_manager_7.13.2_001 x6V232xKQLinqRedJRAbgw 1 0 10 1069 186.4kb 186.4kb yellow open test_index Vh0HutpLRciaMWX3pFo7Zg 1 1 1 0 5.5kb 5.5kb yellow open sshd_fail-2021.06 HiOI2ac-RzK2BiwQ_gb-VQ 1 1 24 0 45.1kb 45.1kb yellow open metricbeat-7.13.2-2021.06.22-000001 aVbbCHScQBujmT8JMRdRBw 1 1 91 0 555.5kb 555.5kb # document list on the index [root@dlp ~]# curl localhost:9200/metricbeat-7.13.2-2021.06.22-000001/_search?pretty
{{
  "took" : 2,
  "timed_out" : false,
  "_shards" : {
    "total" : 1,
    "successful" : 1,
    "skipped" : 0,
    "failed" : 0
  },
  "hits" : {
    "total" : {
      "value" : 136,
      "relation" : "eq"
    },
    "max_score" : 1.0,
    "hits" : [
      {
        "_index" : "metricbeat-7.13.2-2021.06.22-000001",
        "_type" : "_doc",
        "_id" : "hqGLMXoB8xzJeutJLnjC",
        "_score" : 1.0,
        "_source" : {
          "@timestamp" : "2021-06-22T02:27:17.069Z",
          "host" : {
            "ip" : [
              "10.0.0.30",
              "fe80::e38e:e34:9b82:29a2"
            ],
.....
.....
|
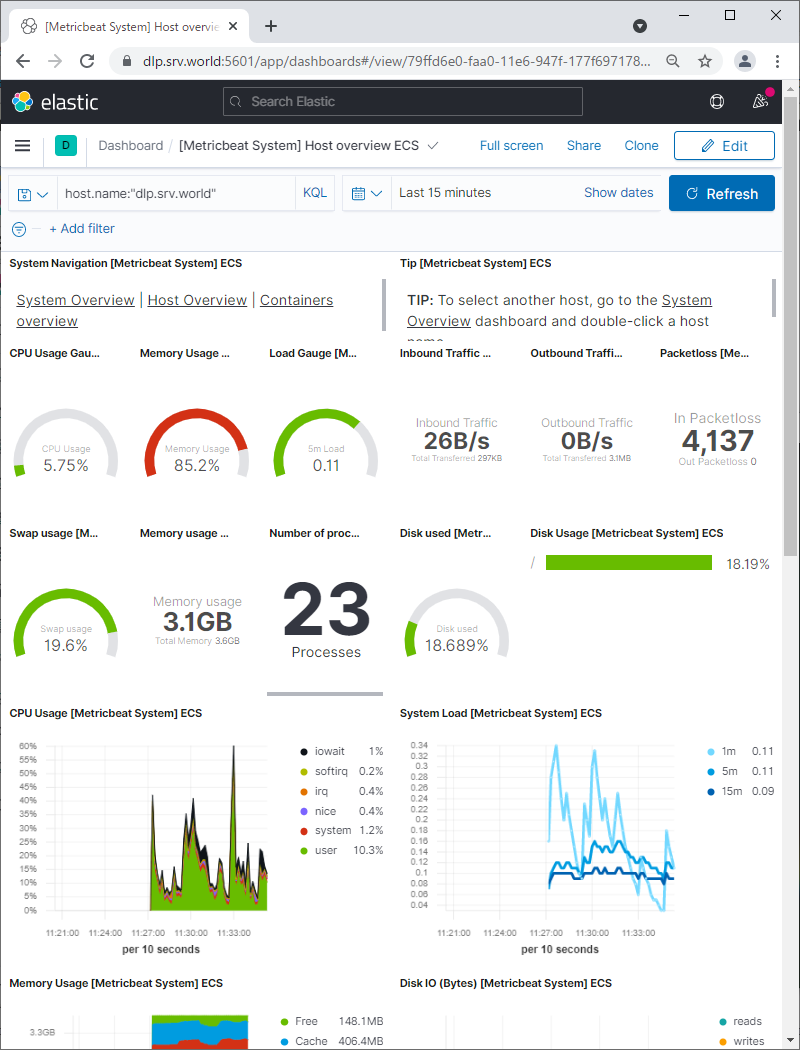
| [4] | If Kibana is running, it's possible to import data to sample Dashboards. |
|
[root@dlp ~]# metricbeat setup --dashboards Loading dashboards (Kibana must be running and reachable) Loaded dashboards |
|
Matched Content