Elastic Stack 7 : Install Logstash2021/06/22 |
|
Install Logstash which collects or manages various logs.
For description of Logstash or how to write the setting file, refer to official site below.
⇒ https://www.elastic.co/guide/en/logstash/current/index.html |
|
| [1] | Install Logstash. Configure Repository for Elasticsearch before it like here. |
|
[root@dlp ~]# dnf -y install logstash
|
| [2] | Create a setting file and start Logstash. For example, create a setting that Logstash collects sshd fail logs from [/var/log/secure] and output to index [sshd_fail-yyyy.mm] in elasticsearch. |
|
[root@dlp ~]#
vi /etc/logstash/conf.d/sshd.conf # create new
input {
  file {
    type => "seucure_log"
    path => "/var/log/secure"
  }
}
filter {
  grok {
    add_tag => [ "sshd_fail" ]
    match => { "message" => "Failed %{WORD:sshd_auth_type} for %{USERNAME:sshd_invalid_user} from %{IP:sshd_client_ip} port %{NUMBER:sshd_port} %{GREEDYDATA:sshd_protocol}" }
  }
}

output {
  elasticsearch {
    hosts => ["http://localhost:9200"]
    index => "sshd_fail-%{+YYYY.MM}"
  }
}
chgrp logstash /var/log/secure [root@dlp ~]# chmod 640 /var/log/secure [root@dlp ~]# systemctl enable --now logstash
|
| [3] | Few minutes later, make sure logs are collected normally. |
|
# show index list [root@dlp ~]# curl localhost:9200/_cat/indices?v health status index uuid pri rep docs.count docs.deleted store.size pri.store.size green open .kibana_7.13.2_001 zA_r0rrjT7OMUMVSGmRVfg 1 0 16 22 2.1mb 2.1mb green open .apm-custom-link d1-9Pkn-RXOu_qhMOanvVA 1 0 0 0 208b 208b green open .kibana-event-log-7.13.2-000001 Y-rCmM6yTBKa9W5H1LeJ1g 1 0 1 0 5.6kb 5.6kb green open .apm-agent-configuration y3hQme2SQpGMtb64NLsNdA 1 0 0 0 208b 208b green open .kibana_task_manager_7.13.2_001 x6V232xKQLinqRedJRAbgw 1 0 10 761 279.3kb 279.3kb yellow open test_index Vh0HutpLRciaMWX3pFo7Zg 1 1 1 0 5.5kb 5.5kb yellow open sshd_fail-2021.06 HiOI2ac-RzK2BiwQ_gb-VQ 1 1 24 0 44.8kb 44.8kb # show document list on index [root@dlp ~]# curl localhost:9200/sshd_fail-2021.06/_search?pretty
{
  "took" : 1,
  "timed_out" : false,
  "_shards" : {
    "total" : 1,
    "successful" : 1,
    "skipped" : 0,
    "failed" : 0
  },
  "hits" : {
    "total" : {
      "value" : 24,
      "relation" : "eq"
    },
    "max_score" : 1.0,
    "hits" : [
      {
        "_index" : "sshd_fail-2021.06",
        "_type" : "_doc",
        "_id" : "bqF2MXoB8xzJeutJBHhI",
        "_score" : 1.0,
        "_source" : {
          "sshd_invalid_user" : "cent",
          "sshd_protocol" : "ssh2",
          "@timestamp" : "2021-06-22T02:04:14.993Z",
          "host" : "dlp.srv.world",
          "type" : "seucure_log",
          "sshd_auth_type" : "password",
          "sshd_client_ip" : "::1",
          "sshd_port" : "33424",
          "tags" : [
            "sshd_fail"
          ],
          "message" : "Jun 21 21:04:14 dlp sshd[3101]: Failed password for cent from ::1 port 33424 ssh2",
          "@version" : "1",
          "path" : "/var/log/secure"
        }
      },
.....
.....
|
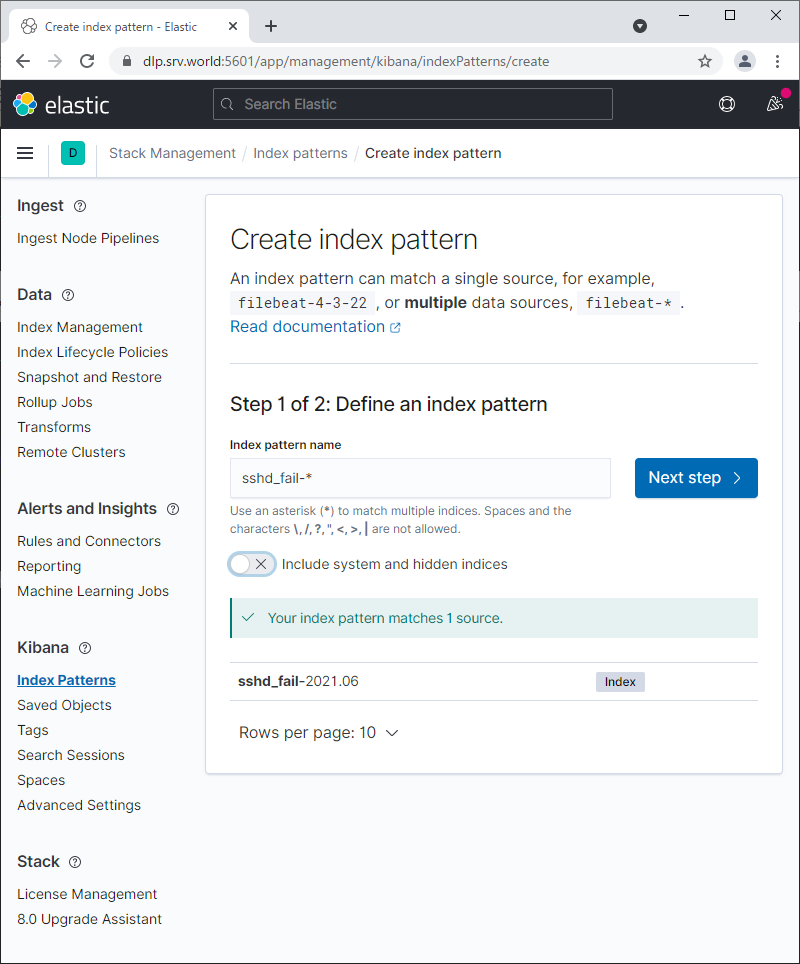
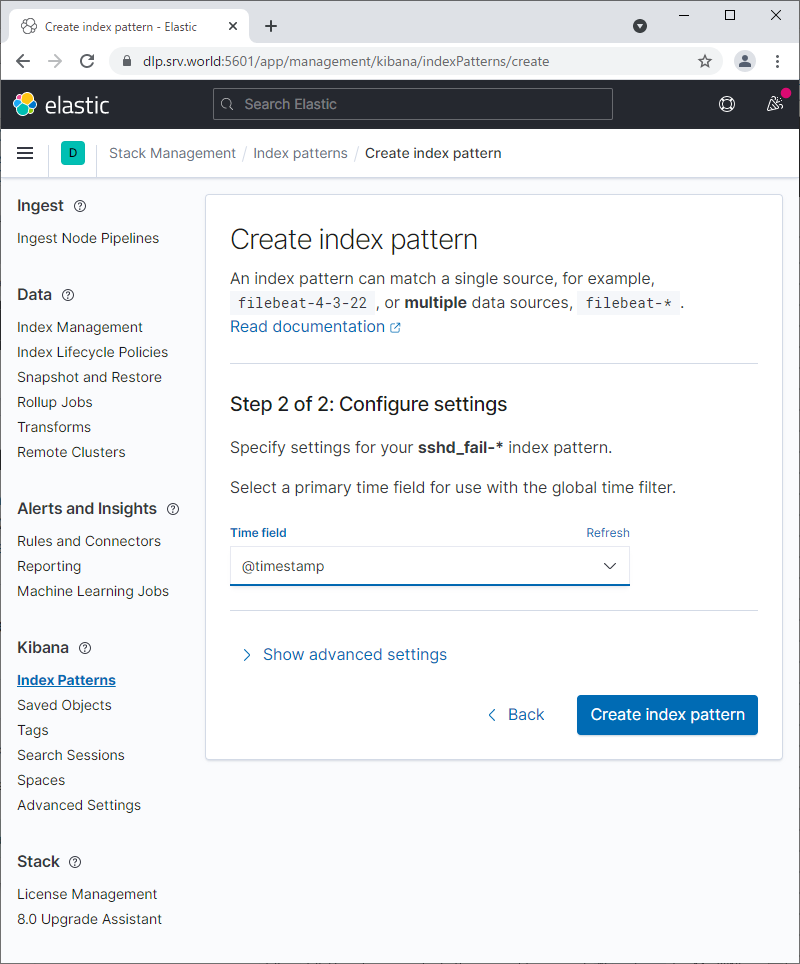
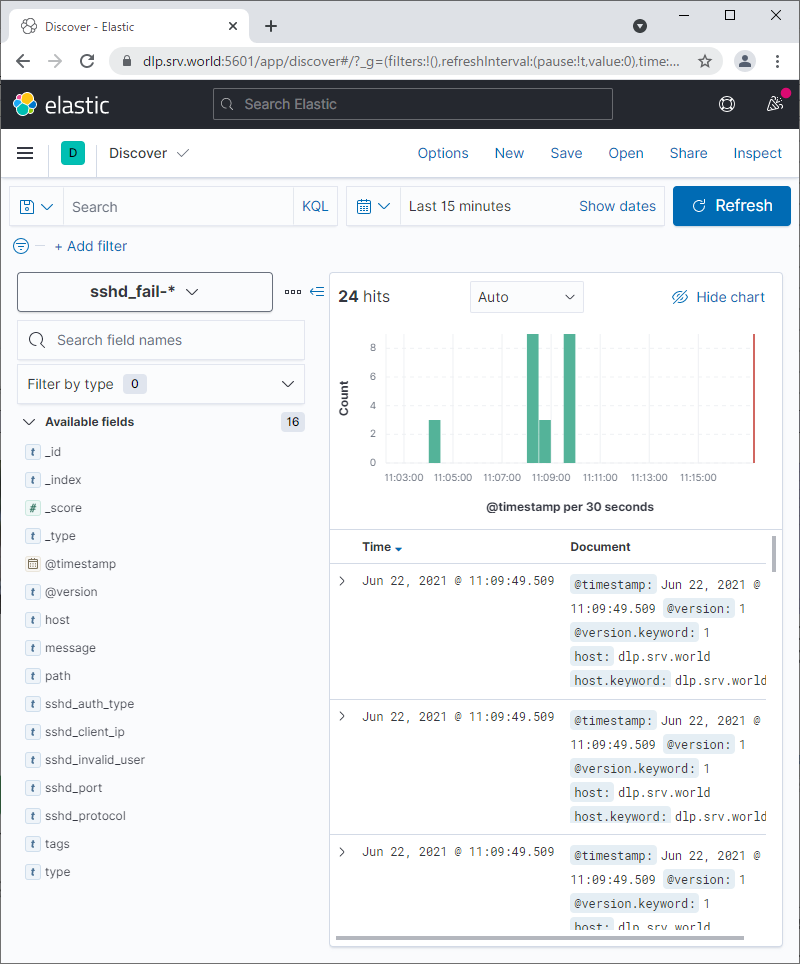
| [4] | If Kibana is running, To add the Index in Kibana, data is imported in it and possible to create visualization you like. |
|
|
|
Matched Content