Prometheus : Blackbox exporter2020/07/29 |
|
To configure Blackbox exporter, it's possible to probe endpoints over HTTP, HTTPS, DNS, TCP and ICMP.
|
|
| [1] | On a Node you'd like to monitor with Blackbox exporter, set Prometheus repository first and Install Blackbox exporter . |
|
[root@node02 ~]# dnf -y install blackbox_exporter
|
| [2] | This is the setting file of Blackbox exporter. (Keep default on this example) |
|
[root@node02 ~]#
vi /etc/prometheus/blackbox.yml
modules:
  http_2xx:
    prober: http
  http_post_2xx:
    prober: http
    http:
      method: POST
  tcp_connect:
    prober: tcp
  pop3s_banner:
    prober: tcp
    tcp:
      query_response:
      - expect: "^+OK"
      tls: true
      tls_config:
        insecure_skip_verify: false
  ssh_banner:
    prober: tcp
    tcp:
      query_response:
      - expect: "^SSH-2.0-"
  irc_banner:
    prober: tcp
    tcp:
      query_response:
      - send: "NICK prober"
      - send: "USER prober prober prober :prober"
      - expect: "PING :([^ ]+)"
        send: "PONG ${1}"
      - expect: "^:[^ ]+ 001"
  icmp:
    prober: icmp
[root@node02 ~]# systemctl enable --now blackbox_exporter
|
| [3] | If Firewalld is running, allow service ports. |
|
[root@node02 ~]# firewall-cmd --add-port=9115/tcp --permanent success [root@node02 ~]# firewall-cmd --reload success |
| [4] | Add settings on Prometheus Server Node. |
|
[root@dlp ~]#
vi /etc/prometheus/prometheus.yml
.....
.....
scrape_configs:
  # The job name is added as a label `job=<job_name>` to any timeseries scraped from this config.
  - job_name: 'prometheus'

.....
.....

  # the case to use [icmp] module
  # any [job_name]
  - job_name: 'Blackbox_icmp'
    metrics_path: /probe
    params:
      module: [icmp]
    static_configs:
      - targets:
        # hostname or IP address of target Host
        - node02.srv.world
    relabel_configs:
      - source_labels: [__address__]
        target_label: __param_target
      - source_labels: [__param_target]
        target_label: instance
      - target_label: __address__
        # Blackbox exporter Host:Port
        replacement: node02.srv.world:9115

  # the case to use [ssh_banner] module
  - job_name: 'Blackbox_ssh'
    metrics_path: /probe
    params:
      module: [ssh_banner]
    static_configs:
      - targets:
        # target Host:Port
        - node02.srv.world:22
    relabel_configs:
      - source_labels: [__address__]
        target_label: __param_target
      - source_labels: [__param_target]
        target_label: instance
      - target_label: __address__
        replacement: node02.srv.world:9115

  # the case to use [tcp_connect] module
  - job_name: 'Blackbox_tcp'
    metrics_path: /probe
    params:
      module: [tcp_connect]
    static_configs:
      - targets:
        # target Host:Port (example below is MariaDB/MySQL)
        - node02.srv.world:3306
    relabel_configs:
      - source_labels: [__address__]
        target_label: __param_target
      - source_labels: [__param_target]
        target_label: instance
      - target_label: __address__
        replacement: node02.srv.world:9115
[root@dlp ~]# systemctl restart prometheus
|
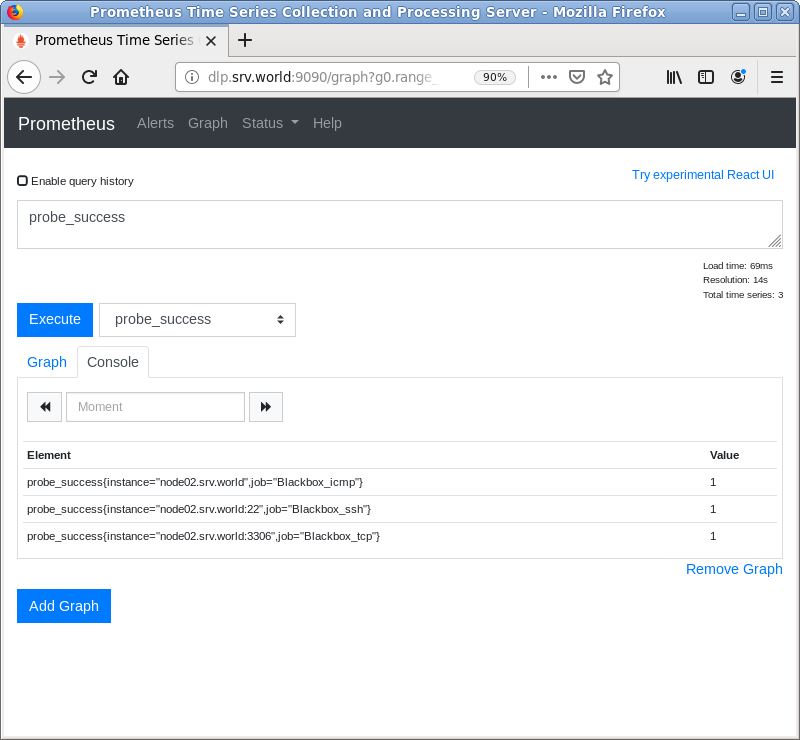
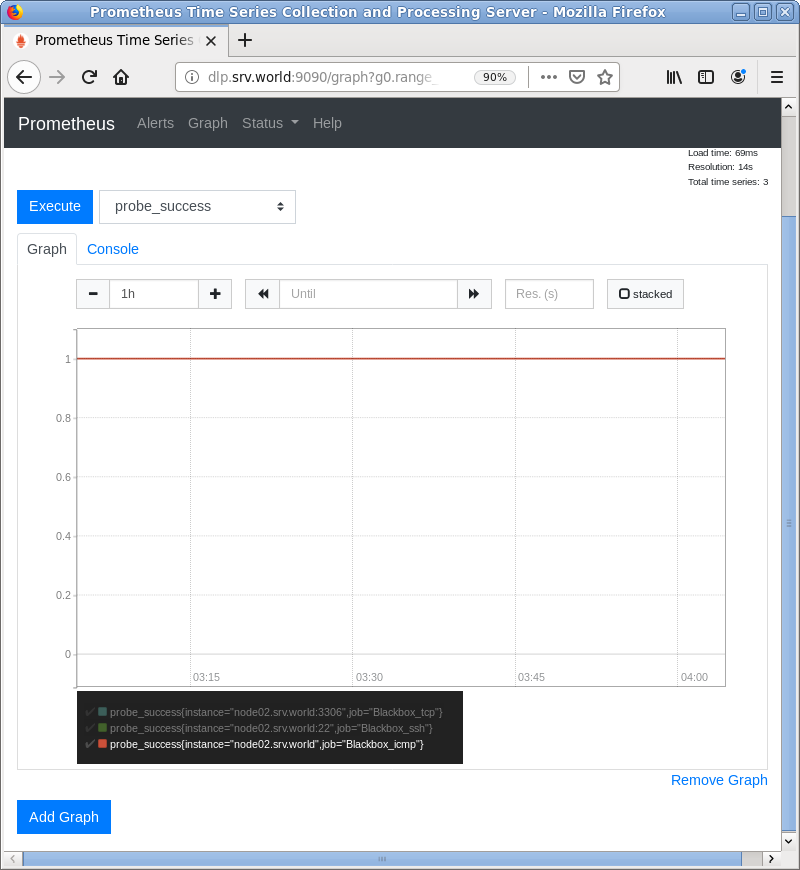
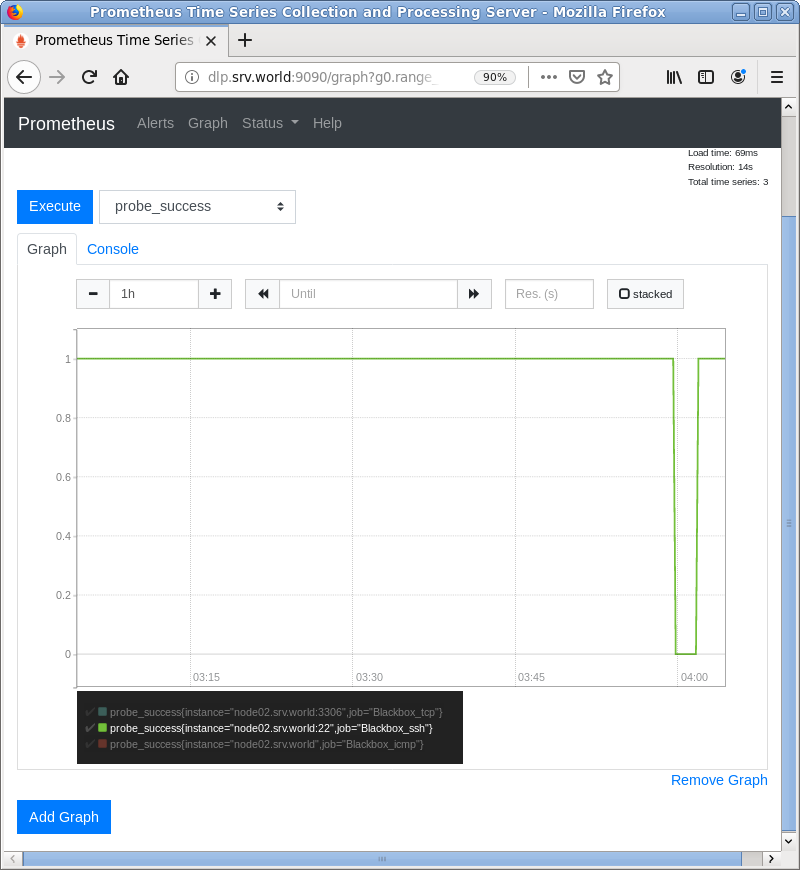
| [5] | Access to the Prometheus Web UI and move to [Status] - [Targets], then new configured targets are shown. It's possible to see data on [probe_success] metric. [1] means success, [0] means fail. |
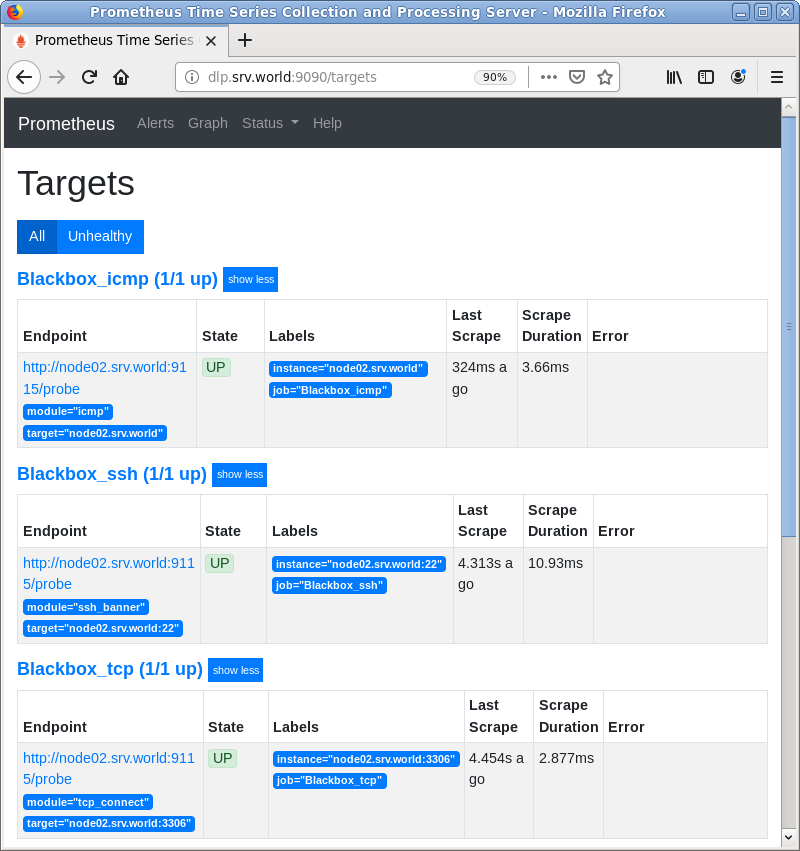
|
|
|
|
Matched Content