Prometheus : Visualize on Grafana2020/07/29 |
|
Web UI is included in Prometheus but it's also possible to visualize time series data on Grafana.
|
|
| [1] |
Install Grafana, refer to here.
It's OK to install it on any Node. (install it on Prometheus server Node on this example) |
| [2] | Install [grafana-prometheus] on Grafana installed Node. (generally it has been installed yet by dependency with Grafana) |
|
[root@dlp ~]# dnf -y install grafana-prometheus
|
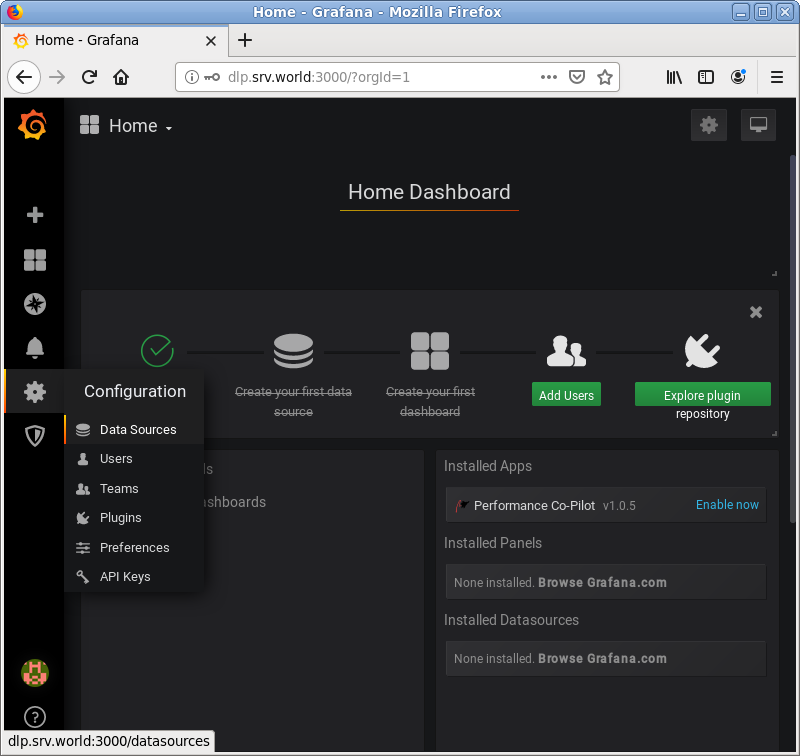
| [3] | Access to Grafana Dashboard and Open [Configuration] - [Data Sources] on the left menu. |
|
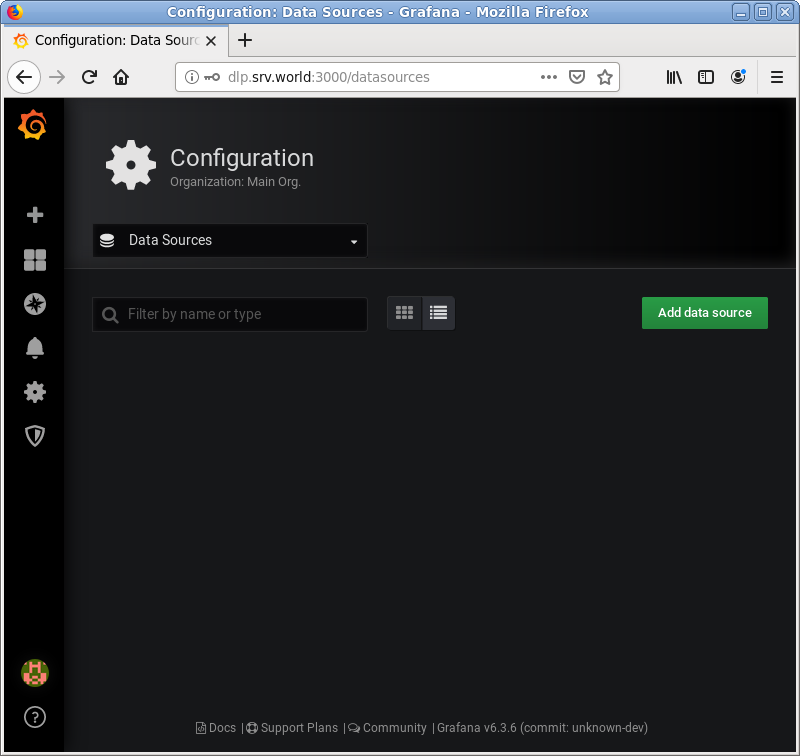
| [4] | Click [Add data source]. |
|
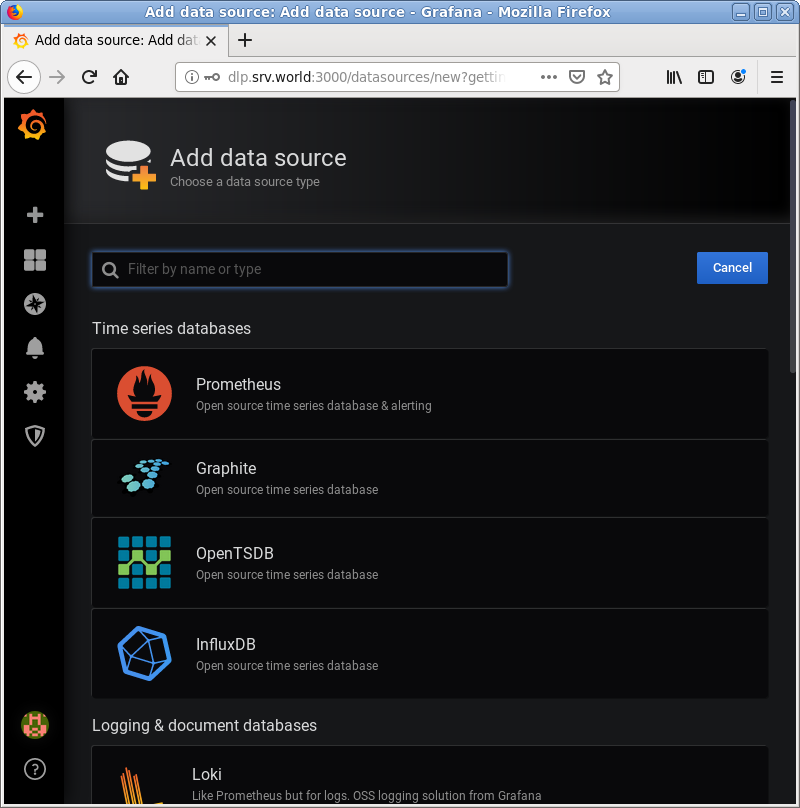
| [5] | Click [Prometheus]. |
|
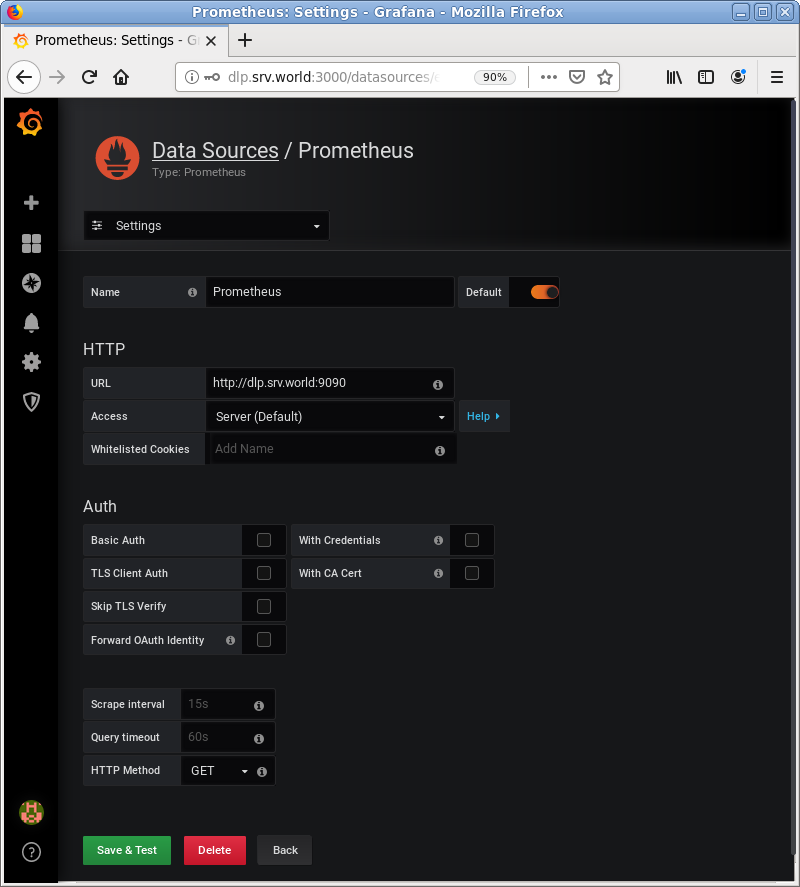
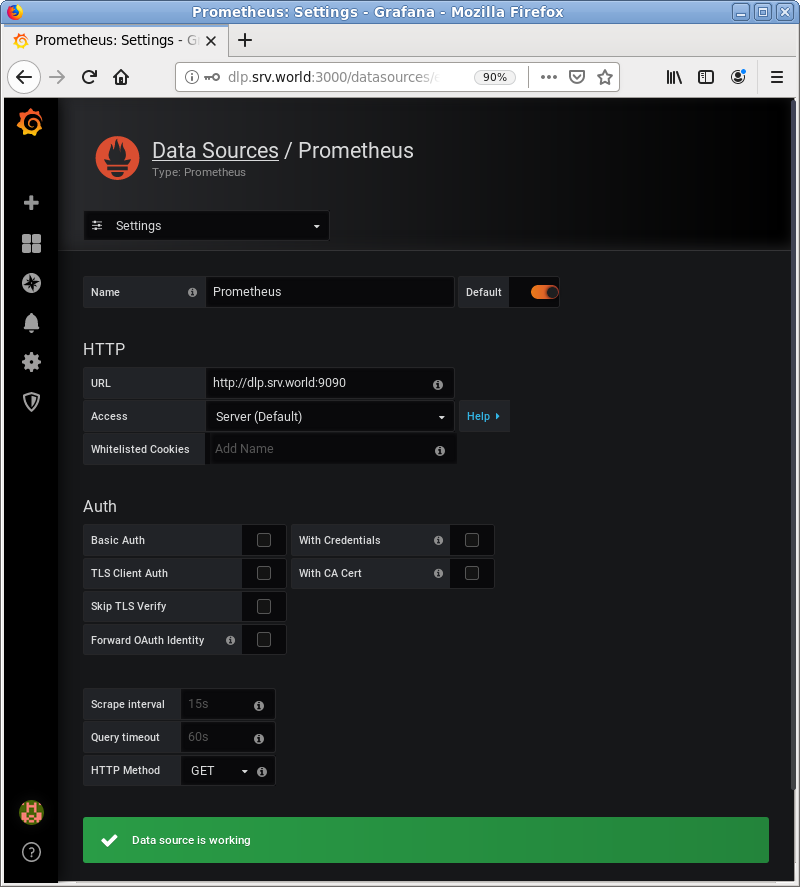
| [6] | Input Prometheus Server endpoint URL on [HTTP] field and Click [Save & Test] button. |
|
| [7] | The message [Data source is working] is shown if that's OK. |
|
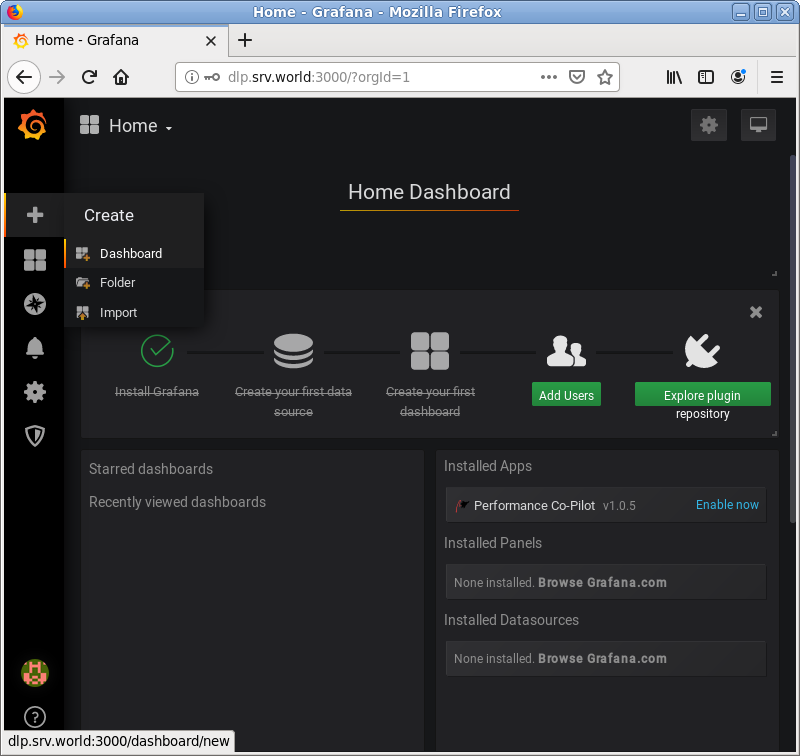
| [8] | Next, Open [Create] - [Dashboard] on the left menu. |
|
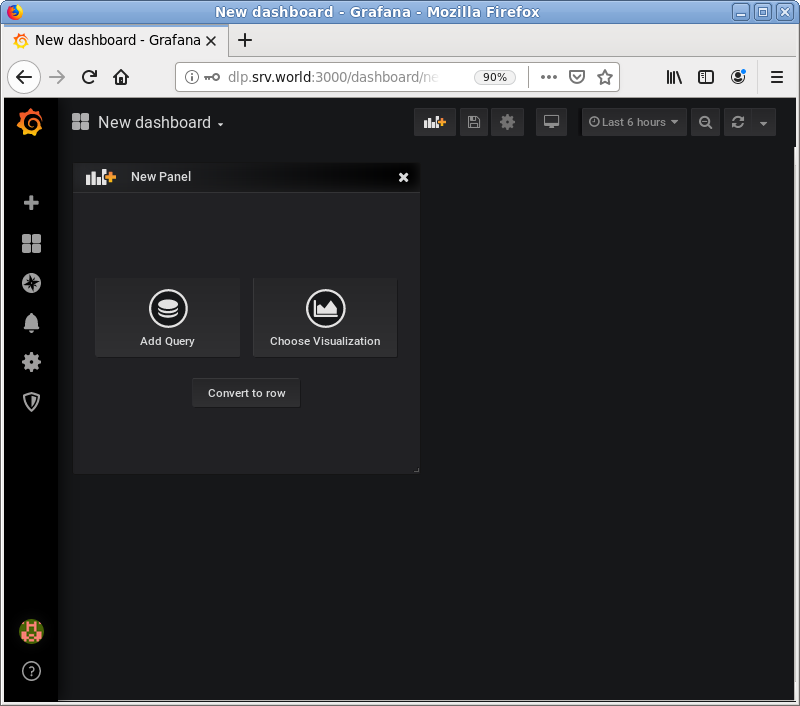
| [9] | Click [Add Query]. |
|
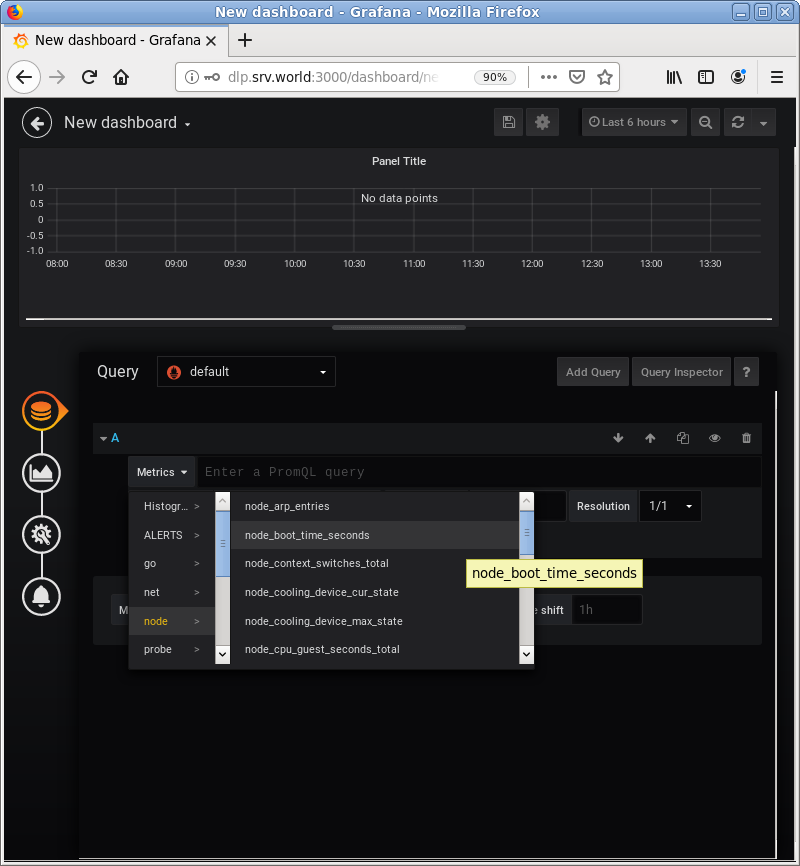
| [10] | Select a query you'd like to visualize data on [Metrics] field. |
|
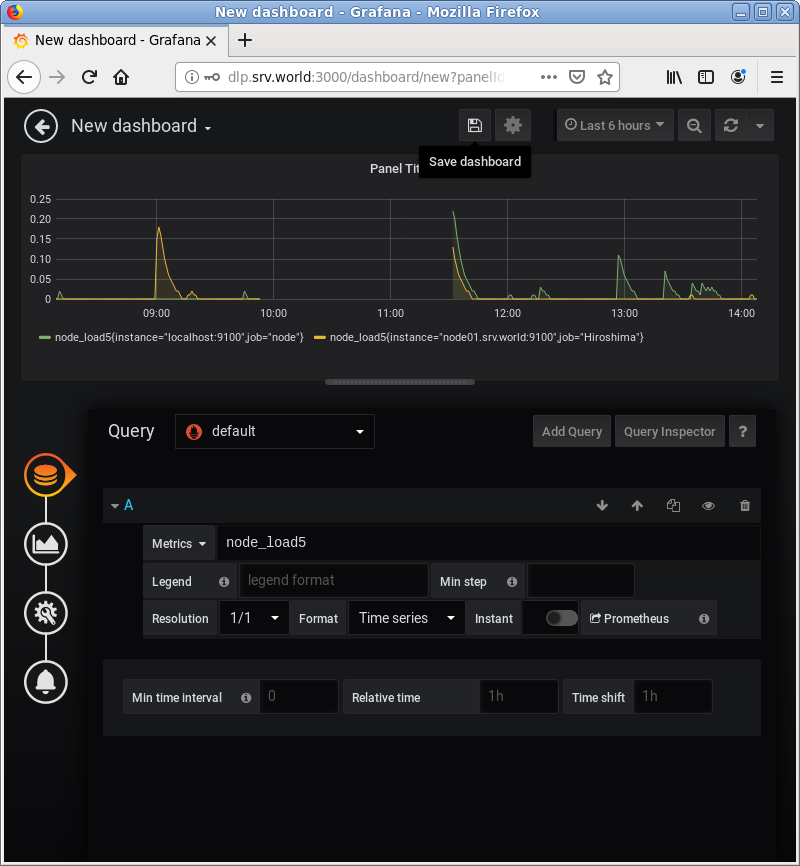
| [11] | After selecting a query, visualized graph is shown. To save [Dashboard], Click [Save dashboard] icon. |
|
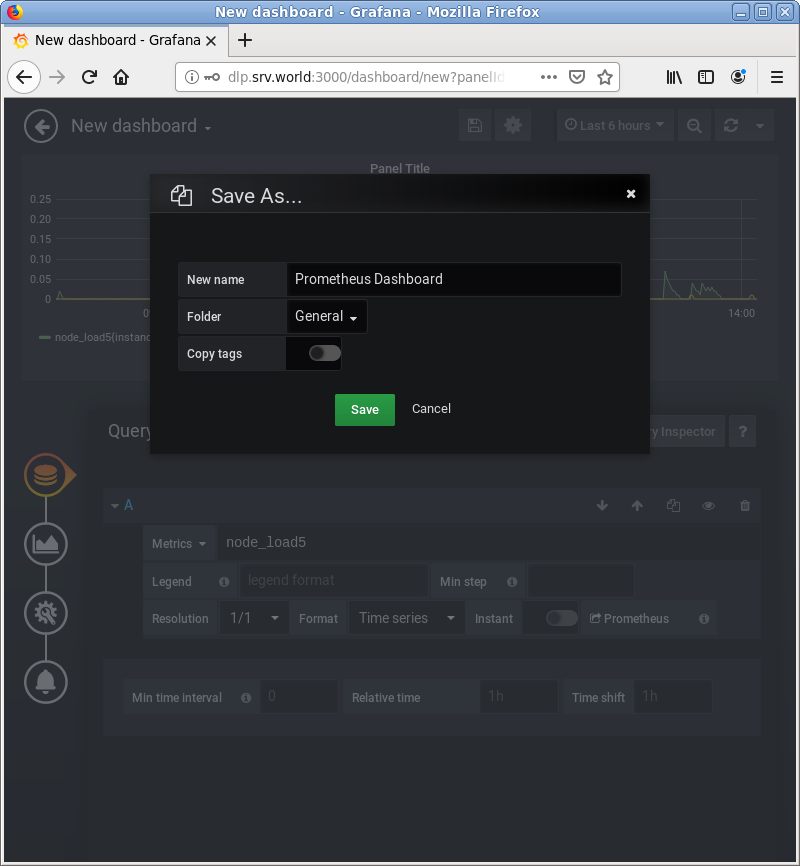
| [12] | Set any Dashboard name and Click [Save] button. |
|
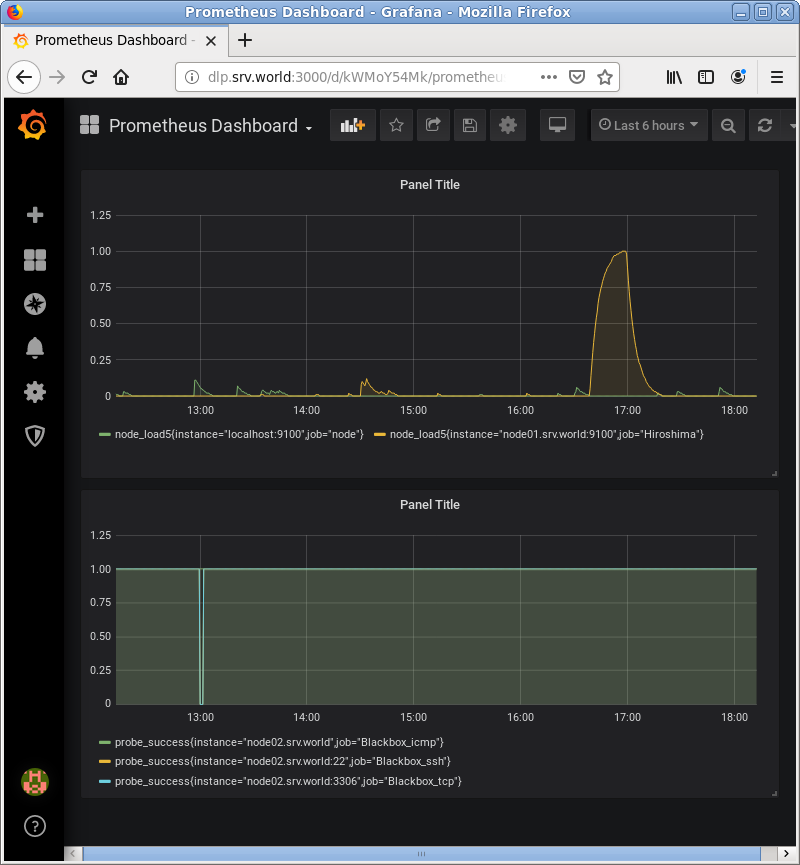
| [13] | To add more queries, it's possible to put more Graphs on a Dashboard. |
|
Matched Content