Monitorix : Install2020/02/20 |
|
Install Monitorix which is a light weight system monitoring tool.
|
|
| [1] | Install Monitorix. |
|
# install from EPEL [root@dlp ~]# dnf --enablerepo=epel -y install monitorix perl-CGI perl-HTTP-Server-Simple perl-rrdtool perl-Config-General perl-LWP-Protocol-https perl-LWP-Protocol-http10
|
| [2] | Configure Monitorix. |
|
[root@dlp ~]#
vi /etc/monitorix/monitorix.conf # line 6: change to any title you like title = Monitorix # line 7: change to your hostname hostname = dlp.server.world # line 8: background color of admin site theme_color = white # line 12: change network units to bps (default is Bytes per/sec) # Bytes per/sec by default netstats_in_bps = y # 28-43: change if you need <httpd_builtin> enabled = y host = port = 8080 user = nobody group = nobody log_file = /var/log/monitorix-httpd # if enable permission for admin site, add settings hosts_deny = all hosts_allow = 10.0.0.0/24 autocheck_responsiveness = y <auth> # if enable Basic auth, turn to [y] enabled = n msg = Monitorix: Restricted access htpasswd = /var/lib/monitorix/htpasswd </auth> </httpd_builtin> # line 76: set kind of graphs you'd like to monitor # Graphs (de)activation # ----------------------------------------------------------------------------- <graph_enable> system = y kern = y proc = y hptemp = n lmsens = n gensens = n ipmi = n ambsens = n nvidia = n disk = n ..... .....[root@dlp ~]# systemctl enable --now monitorix
|
| [3] | If Firewalld is running, allow service port. |
|
[root@dlp ~]# firewall-cmd --add-port=8080/tcp --permanent success [root@dlp ~]# firewall-cmd --reload success |
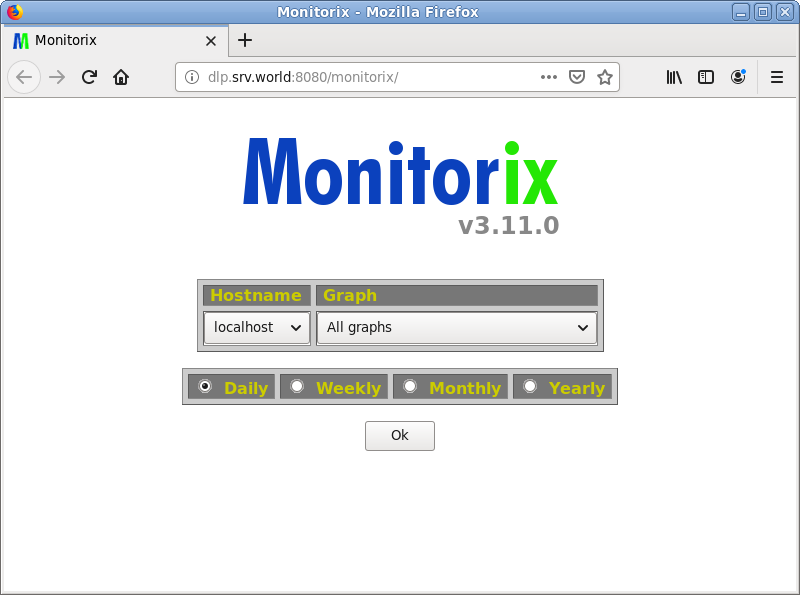
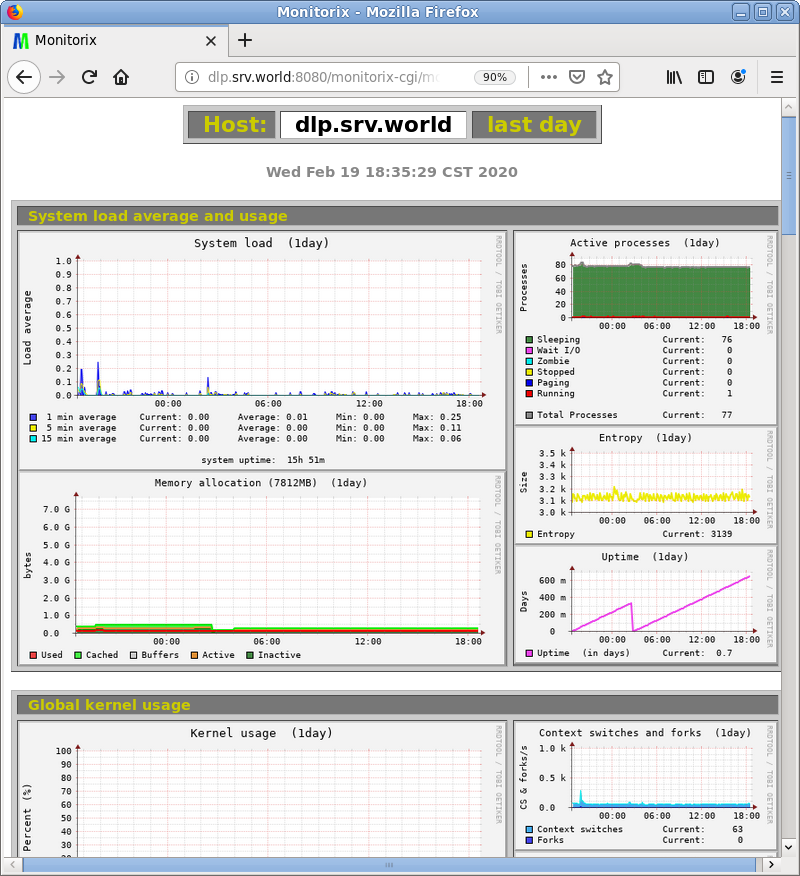
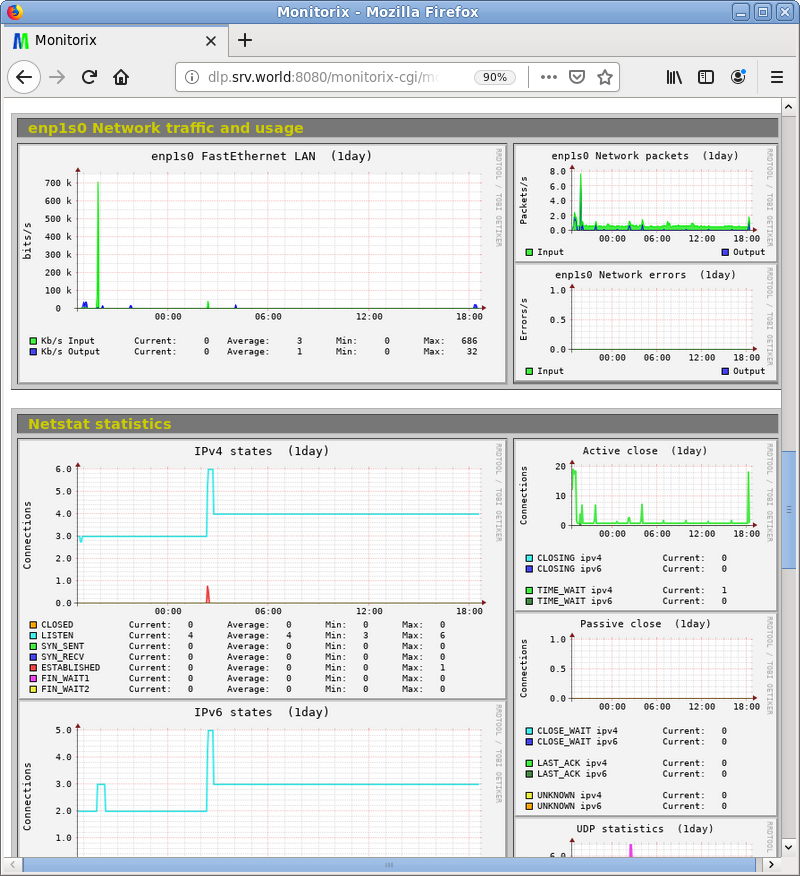
| [4] | Access to the [(Monitorix server's hostname or IP address):8080/monitorix/] from any client which is in the network allowed in config. Then, Monitorix admin site is displayed like follows. Click [OK] to see graphs. |
|
|
|
Matched Content