MRTG : インストール2015/06/16 |
|
MRTG (Multi Router Traffic Grapher) をインストールし、ネットワークの送受信データをグラフで閲覧できるよう設定します。
|
|
| [1] | |
| [2] | MRTG, SNMP をインストールします。 |
|
[root@dlp ~]# yum -y install net-snmp net-snmp-utils mrtg
|
| [3] | SNMP (Simple Network Management Protocol) を設定します。 |
|
[root@dlp ~]#
vi /etc/snmp/snmpd.conf # 41行目:コメントにする # com2sec notConfigUser default public
# 74,75行目:コメント解除して変更 # mynetwork は自ネットワークに変更 # コミュニティ名は public, private 以外に変更 com2sec local localhost Serverworld com2sec mynetwork 10.0.0.0/24 Serverworld
# 78,79行目:コメント解除して変更 group MyRWGroup v2c localgroup MyROGroup v2c mynetwork
# 85行目:コメント解除 view all included .1 80 # 93,94行目:コメント解除して変更 access MyROGroup "" v2c noauth exact all none noneaccess MyRWGroup "" v2c noauth exact all all all
# 動作確認 (「Serverworld」の箇所は設定したコミュニティ名) [root@dlp ~]# snmpwalk -v2c -c Serverworld localhost system SNMPv2-MIB::sysDescr.0 = STRING: Linux dlp.srv.world 3.10.0-229.4.2.el7.x86_64 #1 SMP Wed May..... SNMPv2-MIB::sysObjectID.0 = OID: NET-SNMP-MIB::netSnmpAgentOIDs.10 DISMAN-EVENT-MIB::sysUpTimeInstance = Timeticks: (91954) 0:15:19.54 SNMPv2-MIB::sysContact.0 = STRING: Root <root@localhost> (configure /etc/snmp ..... ..... SNMPv2-MIB::sysORUpTime.9 = Timeticks: (4) 0:00:00.04 SNMPv2-MIB::sysORUpTime.10 = Timeticks: (4) 0:00:00.04 |
| [4] | MRTG の設定です。 |
|
[root@dlp ~]# cfgmaker --snmp-options=:::::2 --ifref=descr --ifdesc=descr Serverworld@10.0.0.30 > /etc/mrtg/mrtg.cfg
[root@dlp ~]#
vi /etc/mrtg/mrtg.cfg # 8行目:追記 WorkDir: /var/www/mrtg # 16行目:コメント解除 Options[_]: growright, bits # 75行目あたりから以下全行コメント解除 & MaxBytes の値のみ変更 Target[10.0.0.30_eth0]: \eth0:Serverworld@10.0.0.30:::::2 noHC[10.0.0.30_eth0]: yes SetEnv[10.0.0.30_eth0]: MRTG_INT_IP="10.0.0.30" MRTG_INT_DESCR="eth0" MaxBytes[10.0.0.30_eth0]: 125000000 Title[10.0.0.30_eth0]: eth0 -- dlp.srv.world PageTop[10.0.0.30_eth0]: <h1>eth0 -- dlp.srv.world</h1> ..... ..... # mrtg を3回手動実行 (過去ファイルを処理するため初回は 2回目実行分まで警告が出る) [root@dlp ~]# for (( i=1 ; i <= 3 ; i++ )); do env LANG=C mrtg /etc/mrtg/mrtg.cfg; done 2015-06-16 19:54:12, Rateup WARNING: /usr/bin/rateup could not read the primary log file for 10.0.0.30_eth0 2015-06-16 19:54:12, Rateup WARNING: /usr/bin/rateup The backup log file for 10.0.0.30_eth0 was invalid as well 2015-06-16 19:54:12, Rateup WARNING: /usr/bin/rateup Can't rename 10.0.0.30_eth0.log to 10.0.0.30_eth0.old updating log file # インデックスファイル作成 [root@dlp ~]# indexmaker --columns=1 /etc/mrtg/mrtg.cfg > /var/www/mrtg/index.html
# Cron 登録
[root@dlp ~]#
vi /etc/cron.d/mrtg
*/5 * * * * root LANG=C LC_ALL=C /usr/bin/mrtg /etc/mrtg/mrtg.cfg --lock-file /var/lock/mrtg/mrtg_l --confcache-file /var/lib/mrtg/mrtg.ok
|
| [5] | ローカルホスト以外からも MRTG のグラフが閲覧できるよう httpd を設定します。 |
|
[root@dlp ~]#
vi /etc/httpd/conf.d/mrtg.conf # 10行目:コメント解除してアクセス許可する範囲を追記, 11行目:DirectoryIndex 追記 Require ip 10.0.0.0/24
DirectoryIndex index.html systemctl start httpd |
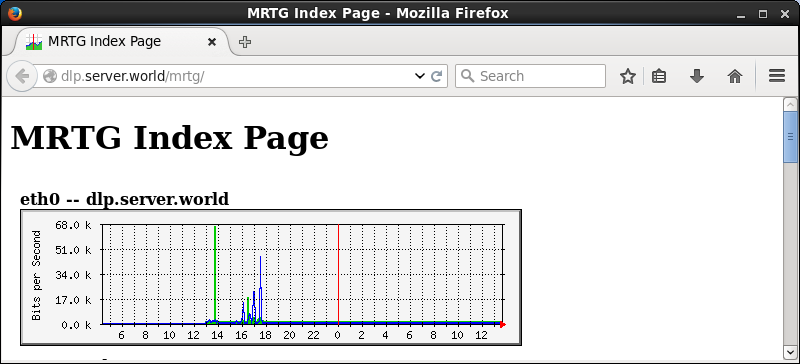
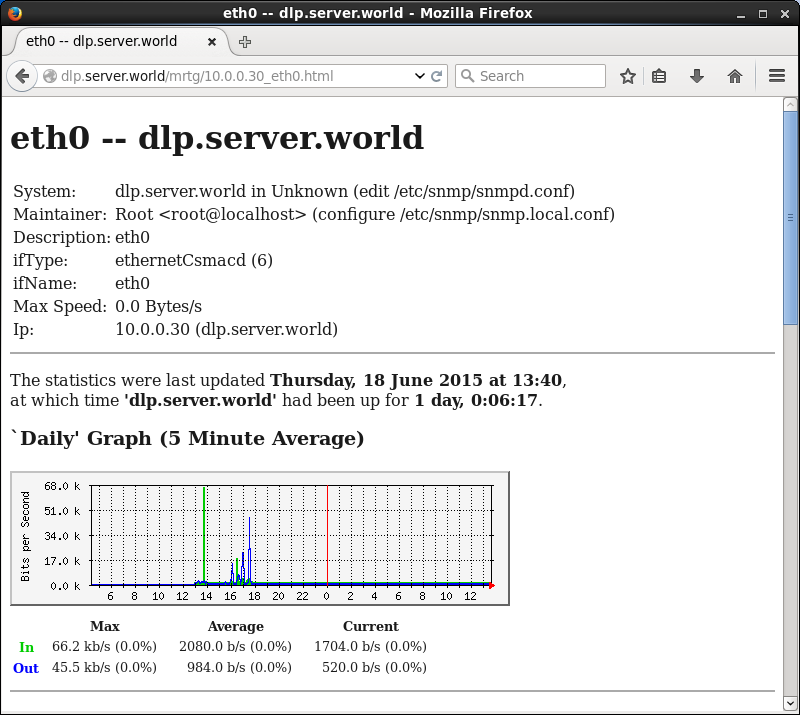
| [6] | 任意のアクセス許可したネットワーク内のクライアントから「http://(MRTGサーバー名またはIPアドレス)/mrtg/」にアクセスすると、 以下のようにネットワークトラフィック量が閲覧できます。 |
|
|
関連コンテンツ