Kubernetes : Prometheus でモニタリングする2022/11/03 |
|
Prometheus をインストールして、Kubernetes クラスターの各種メトリクスをモニタリングできるようにします。
当例では以下のように 3 台のノードを使用して Kubernetes クラスターを構成しています。
-----------+---------------------------+--------------------------+------------
           |                           |                          |
       eth0|10.0.0.25              eth0|10.0.0.71             eth0|10.0.0.72
+----------+-----------+   +-----------+-----------+   +-----------+-----------+
|  [ ctrl.srv.world ]  |   |  [snode01.srv.world]  |   |  [snode02.srv.world]  |
|     Control Plane    |   |      Worker Node      |   |      Worker Node      |
+----------------------+   +-----------------------+   +-----------------------+
|
| [1] |
Prometheus が使用する外部ストレージが必要となります。
当例では、こちらの [1], [2], [3] の通り、Control Plane ノード上に NFS サーバーを起動し、[/home/nfsshare] ディレクトリを共有ディレクトリとして設定して、Prometheus が使用するボリュームを動的プロビジョニングできるよう NFS subdir external provisioner を設定して進めます。 |
| [2] | Helm で Prometheus チャートをインストールします。 |
|
# Prometheus の設定を書き出して自身の環境用に変更 root@ctrl:~# helm inspect values bitnami/kube-prometheus > prometheus.yaml
root@ctrl:~#
vi prometheus.yaml
.....
.....
    18行目 : 使用する storageClass を指定
    storageClass: "nfs-client"
.....
.....
.....
    995行目 : 使用する storageClass を指定
    storageClass: "nfs-client"
.....
.....
.....
    1840行目 : 使用する storageClass を指定
    storageClass: "nfs-client"
# Prometheus 用のネームスペース作成 root@ctrl:~# kubectl create namespace monitoring namespace/monitoring created helm install prometheus --namespace monitoring -f prometheus.yaml bitnami/kube-prometheus
NAME: prometheus
LAST DEPLOYED: Thu Nov  3 07:23:48 2022
NAMESPACE: monitoring
STATUS: deployed
REVISION: 1
TEST SUITE: None
NOTES:
CHART NAME: kube-prometheus
CHART VERSION: 8.1.11
APP VERSION: 0.60.1

** Please be patient while the chart is being deployed **

Watch the Prometheus Operator Deployment status using the command:

    kubectl get deploy -w --namespace monitoring -l app.kubernetes.io/name=kube-prometheus-operator,app.kubernetes.io/instance=prometheus

Watch the Prometheus StatefulSet status using the command:

    kubectl get sts -w --namespace monitoring -l app.kubernetes.io/name=kube-prometheus-prometheus,app.kubernetes.io/instance=prometheus

Prometheus can be accessed via port "9090" on the following DNS name from within your cluster:

    prometheus-kube-prometheus-prometheus.monitoring.svc.cluster.local

To access Prometheus from outside the cluster execute the following commands:

    echo "Prometheus URL: http://127.0.0.1:9090/"
    kubectl port-forward --namespace monitoring svc/prometheus-kube-prometheus-prometheus 9090:9090

Watch the Alertmanager StatefulSet status using the command:

    kubectl get sts -w --namespace monitoring -l app.kubernetes.io/name=kube-prometheus-alertmanager,app.kubernetes.io/instance=prometheus

Alertmanager can be accessed via port "9093" on the following DNS name from within your cluster:

    prometheus-kube-prometheus-alertmanager.monitoring.svc.cluster.local

To access Alertmanager from outside the cluster execute the following commands:

    echo "Alertmanager URL: http://127.0.0.1:9093/"
    kubectl port-forward --namespace monitoring svc/prometheus-kube-prometheus-alertmanager 9093:9093
root@ctrl:~# kubectl get pods -n monitoring -o wide NAME READY STATUS RESTARTS AGE IP NODE NOMINATED NODE READINESS GATES alertmanager-prometheus-kube-prometheus-alertmanager-0 2/2 Running 1 (96s ago) 106s 192.168.211.131 snode02.srv.world <none> <none> prometheus-kube-prometheus-blackbox-exporter-ff46dc456-ft2z2 1/1 Running 0 2m11s 192.168.211.130 snode02.srv.world <none> <none> prometheus-kube-prometheus-operator-6b75d4f48b-vf95h 1/1 Running 0 2m11s 192.168.186.67 snode01.srv.world <none> <none> prometheus-kube-state-metrics-85647b4c64-r58qp 1/1 Running 0 2m11s 192.168.186.68 snode01.srv.world <none> <none> prometheus-node-exporter-lmww4 1/1 Running 0 2m11s 10.0.0.72 snode02.srv.world <none> <none> prometheus-node-exporter-zt5dp 1/1 Running 0 2m11s 10.0.0.71 snode01.srv.world <none> <none> prometheus-prometheus-kube-prometheus-prometheus-0 2/2 Running 0 106s 192.168.186.69 snode01.srv.world <none> <none> # もしクラスター外からアクセスする場合はポートフォワード root@ctrl:~# kubectl port-forward -n monitoring service/prometheus-kube-prometheus-prometheus --address 0.0.0.0 9090:9090 |
| [3] | Grafana もインストールする場合は、同様にインストール可能です。 |
|
# 設定を書き出して storageClassName を変更 root@ctrl:~# helm inspect values bitnami/grafana > grafana.yaml
root@ctrl:~#
vi grafana.yaml 552行目 : 自身の [storageClass] を指定 persistence: enabled: true ## If defined, storageClassName: <storageClass> ## If set to "-", storageClassName: "", which disables dynamic provisioning ## If undefined (the default) or set to null, no storageClassName spec is ## set, choosing the default provisioner. (gp2 on AWS, standard on ## GKE, AWS & OpenStack) ## storageClass: "nfs-client"root@ctrl:~# helm install grafana --namespace monitoring -f grafana.yaml bitnami/grafana
NAME: grafana
LAST DEPLOYED: Thu Nov  3 07:40:10 2022
NAMESPACE: monitoring
STATUS: deployed
REVISION: 1
TEST SUITE: None
NOTES:
CHART NAME: grafana
CHART VERSION: 8.2.15
APP VERSION: 9.2.3

** Please be patient while the chart is being deployed **

1. Get the application URL by running these commands:
    echo "Browse to http://127.0.0.1:8080"
    kubectl port-forward svc/grafana 8080:3000 &

2. Get the admin credentials:

    echo "User: admin"
    echo "Password: $(kubectl get secret grafana-admin --namespace monitoring -o jsonpath="{.data.GF_SECURITY_ADMIN_PASSWORD}" | base64 -d)"
root@ctrl:~# kubectl get pods -n monitoring NAME READY STATUS RESTARTS AGE grafana-57dc4598d9-zhwvg 1/1 Running 0 68s ..... ..... # もしクラスター外からアクセスする場合はポートフォワード root@ctrl:~# kubectl port-forward -n monitoring service/grafana --address 0.0.0.0 3000:3000 |
| [4] |
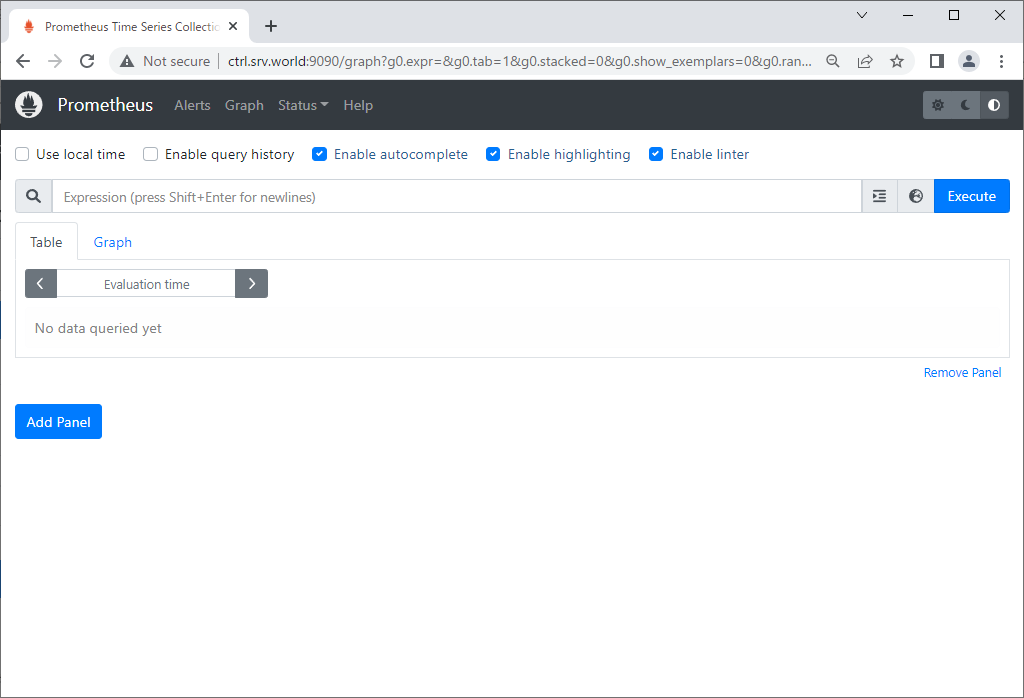
クラスタ―内ホストから Prometheus UI にアクセスする場合は Web ブラウザーを起動して、以下の URL にアクセスします。
⇒ http://prometheus-kube-prometheus-prometheus.monitoring.svc.cluster.local
ポートフォワーディングした場合は、ローカルネットワーク内の任意のコンピューターで Web ブラウザーを起動して、以下の URL にアクセスします。
⇒ http://(Control Plane ノードのホスト名 または IP アドレス):(設定したポート)/
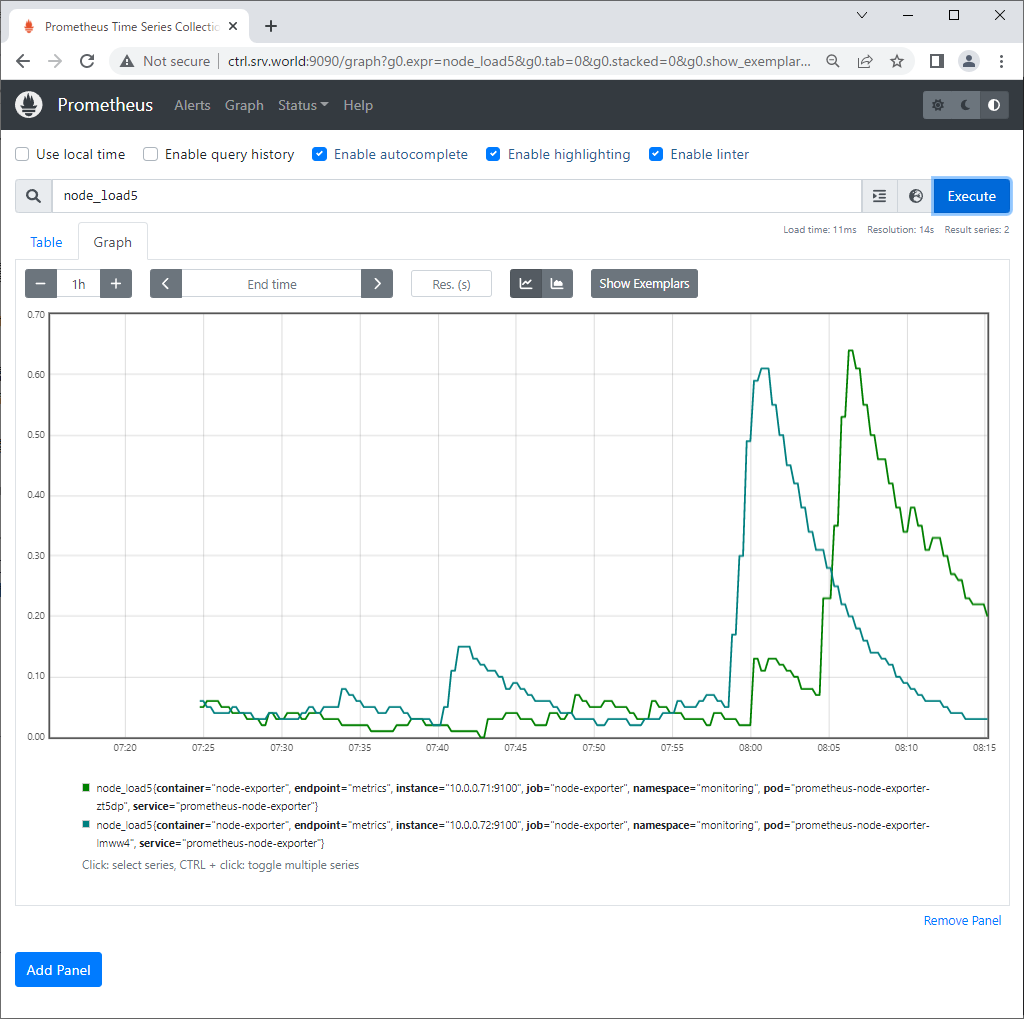
以下のように Prometheus UI が表示されれば OK です。
|
|
|
| [5] |
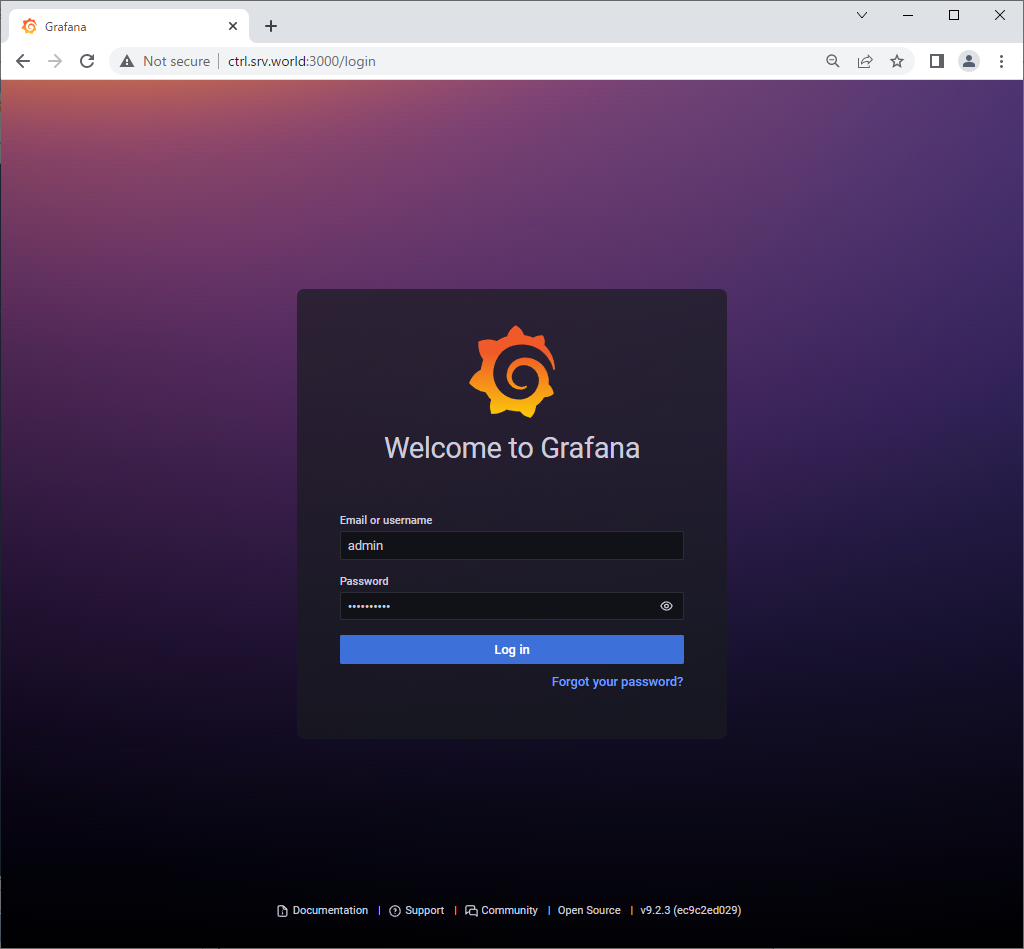
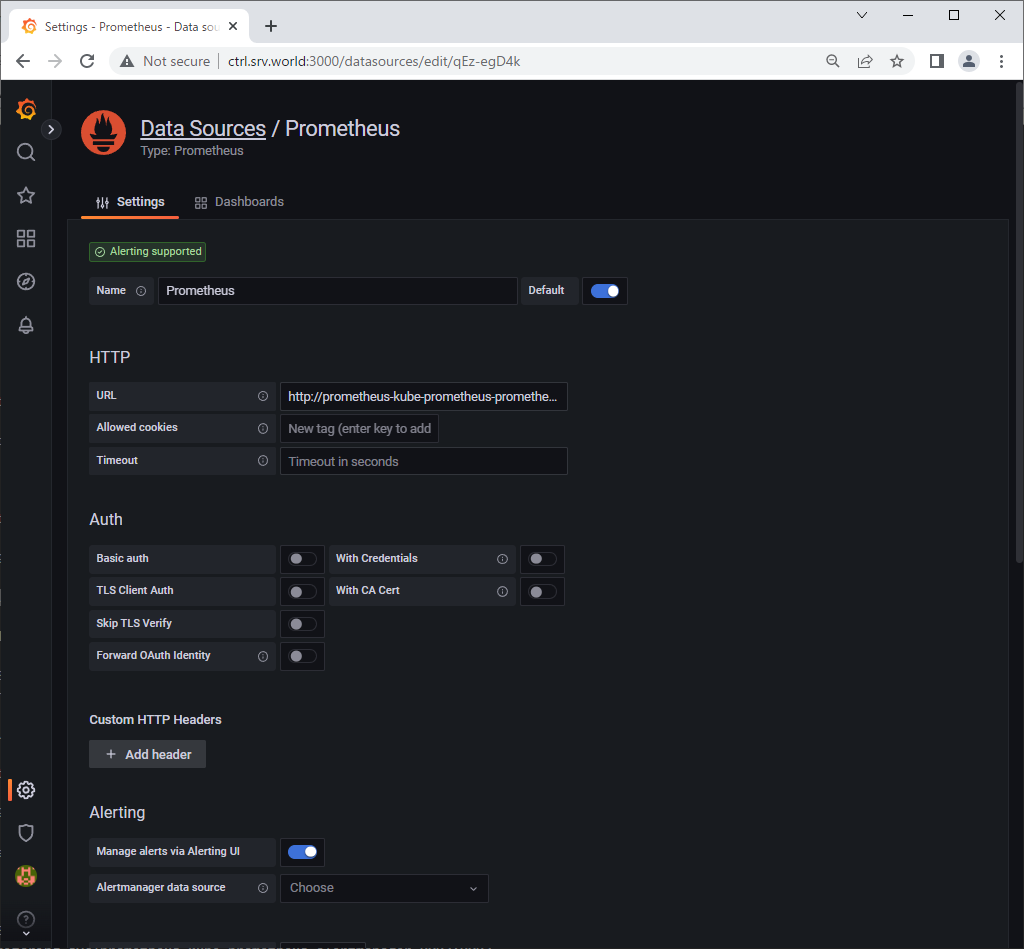
クラスタ―内ホストから Grafana にアクセスする場合は Web ブラウザーを起動して、以下の URL にアクセスします。
⇒ http://grafana.monitoring.svc.cluster.local
ポートフォワーディングした場合は、ローカルネットワーク内の任意のコンピューターで Web ブラウザーを起動して、以下の URL にアクセスします。
⇒ http://(Control Plane ノードのホスト名 または IP アドレス):(設定したポート)/
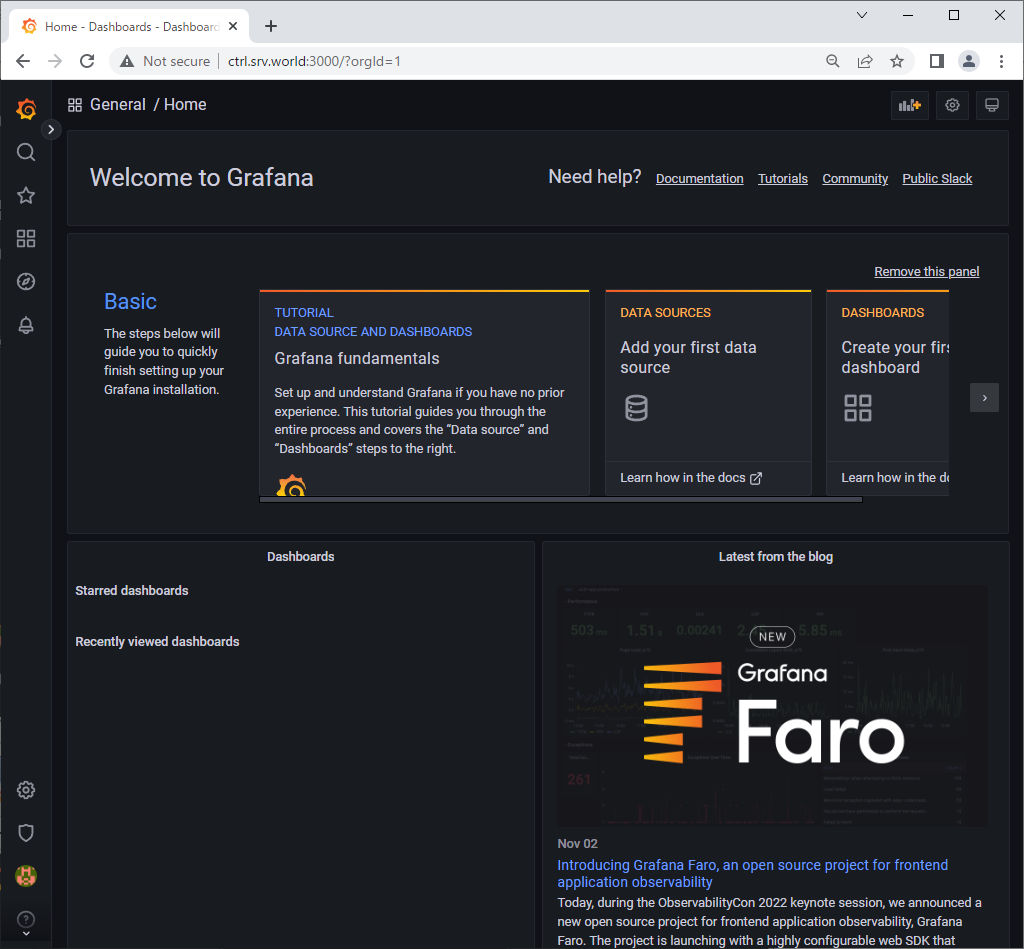
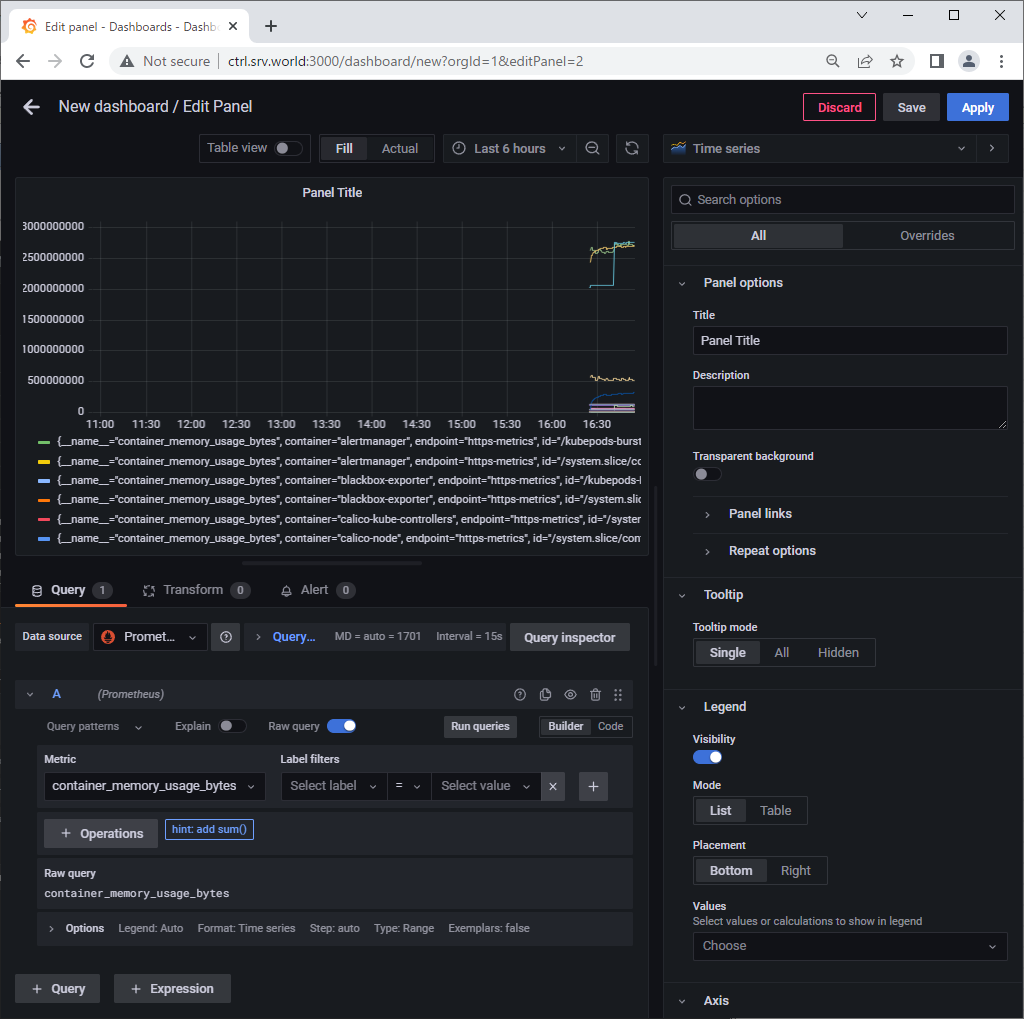
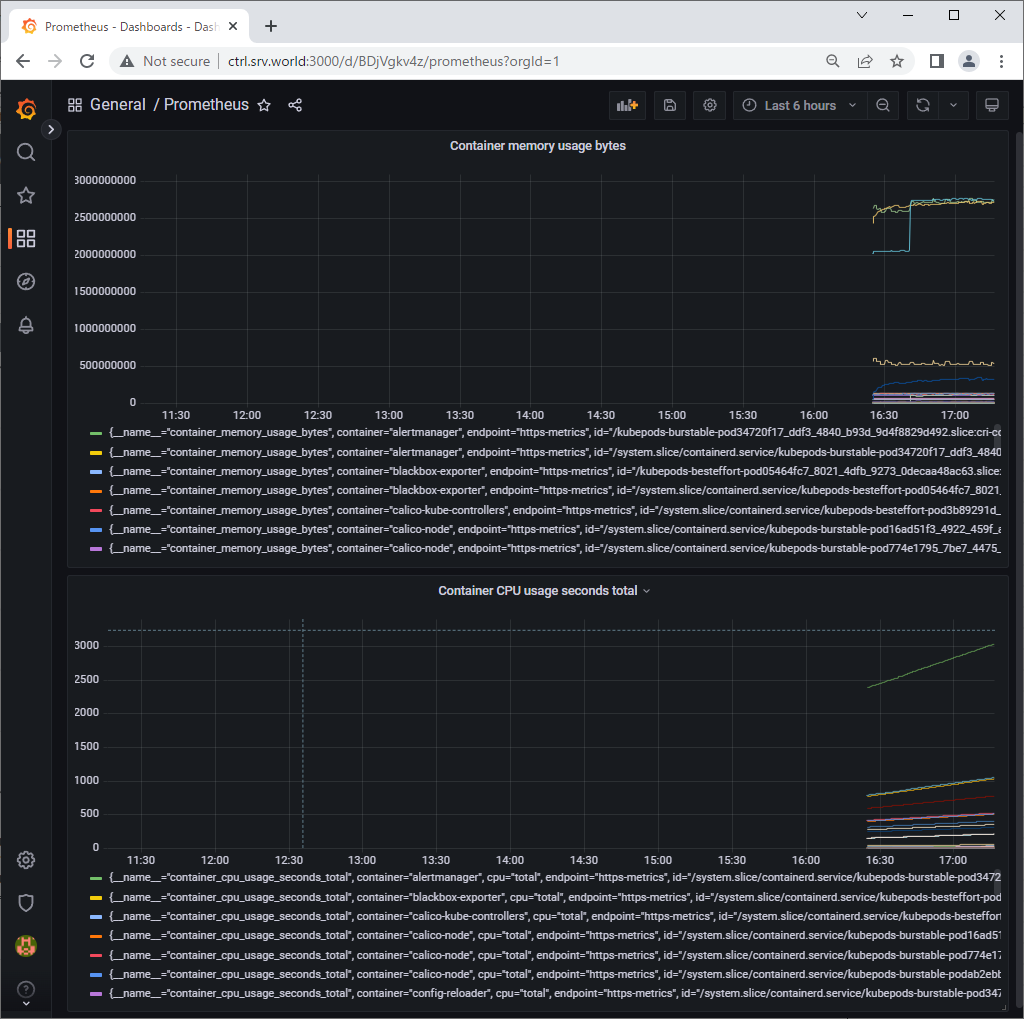
以下のように Grafana が表示されれば OK です。
[admin] パスワードは以下のコマンドで確認します。⇒ echo "Password: $(kubectl get secret grafana-admin --namespace monitoring -o jsonpath="{.data.GF_SECURITY_ADMIN_PASSWORD}" | base64 -d)" |
|
|
|
|
|
関連コンテンツ