Elastic Stack 8 : Metricbeat インストール2022/11/09 |
|
CPU やメモリー使用量等のシステム情報のデータ収集機能を提供する Metricbeat をインストールします。
システム情報以外にも、設定により Apache や MySQL のメトリックも収集可能です。詳細は公式サイトを参照ください。
⇒ https://www.elastic.co/guide/en/beats/metricbeat/current/metricbeat-modules.html |
|
| [1] | Metricbeat をインストールします。 事前に Elasticsearch リポジトリ設定済みであることが前提です。 |
|
root@dlp:~# apt -y install metricbeat
|
| [2] | 基本的な設定をして Metricbeat を起動します。 |
|
root@dlp:~#
vi /etc/metricbeat/metricbeat.yml # 67行目 : Kibana を使用する場合はコメント解除して出力先を指定 # Kibana で SSL 有効の場合は証明書に登録したホスト名と合わせる # [username], [password] は管理ユーザーのユーザー名とパスワード # 自己署名の証明書を使用している場合は [ssl.verification_mode: none] setup.kibana: ..... host: "https://dlp.srv.world:5601" protocol: "https" username: "elastic" password: "password" ssl.enabled: true ssl.verification_mode: none # 98行目 : Elasticsearch の出力先を指定する # [username], [password] は管理ユーザーのユーザー名とパスワード # [ssl.certificate_authorities] は Elasticsearch で生成された cacert output.elasticsearch: # Array of hosts to connect to. hosts: ["https://dlp.srv.world:9200"] protocol: "https" username: "elastic" password: "password" ssl.certificate_authorities: "/etc/elasticsearch/certs/http_ca.crt" ..... .....
root@dlp:~#
vi /etc/metricbeat/metricbeat.reference.yml # 61行目 : 収集する項目を設定 # コメントアウト/コメント解除で有効/無効にする
- module: system
  metricsets:
    - cpu             # CPU usage
    - load            # CPU load averages
    - memory          # Memory usage
    - network         # Network IO
    - process         # Per process metrics
    - process_summary # Process summary
    - uptime          # System Uptime
    - socket_summary  # Socket summary
    #- core           # Per CPU core usage
    #- diskio         # Disk IO
    #- filesystem     # File system usage for each mountpoint
    #- fsstat         # File system summary metrics
    #- raid           # Raid
    #- socket         # Sockets and connection info (linux only)
    #- service        # systemd service information
  enabled: true
  period: 10s
  processes: ['.*']
# 2677行目 : Kibana を使用する場合はコメント解除して出力先を指定 # Kibana で SSL 有効の場合は ssl 系設定をコメント解除 # [username], [password] は管理ユーザーのユーザー名とパスワード # 自己署名の証明書を使用している場合は [ssl.verification_mode: none] setup.kibana: # Kibana Host # Scheme and port can be left out and will be set to the default (http and 5601) # In case you specify and additional path, the scheme is required: http://localhost:5601/path # IPv6 addresses should always be defined as: https://[2001:db8::1]:5601 host: "https://dlp.srv.world:5601" # Optional protocol and basic auth credentials. protocol: "https" username: "elastic" password: "password" # Optional HTTP path #path: "" # Optional Kibana space ID. #space.id: "" # Use SSL settings for HTTPS. ssl.enabled: true ..... ..... # after very careful consideration. It is primarily intended as a temporary # diagnostic mechanism when attempting to resolve TLS errors; its use in # production environments is strongly discouraged. # The default value is full. ssl.verification_mode: noneroot@dlp:~# systemctl enable --now metricbeat
|
| [3] | データが取り込まれているか確認しておきます。 |
|
# index 一覧 root@dlp:~# curl -u elastic --cacert /etc/elasticsearch/certs/http_ca.crt https://127.0.0.1:9200/_cat/indices?v Enter host password for user 'elastic' health status index uuid pri rep docs.count docs.deleted store.size pri.store.size yellow open .ds-metricbeat-8.5.0-2022.11.09-000001 MRfmgqLxSGCLapOAJDDZww 1 1 6412 0 9.1mb 9.1mb yellow open test_index Yw-_PdilSIueIBLM9KmihQ 1 1 1 0 6.4kb 6.4kb # index のドキュメント一覧 root@dlp:~# curl -u elastic --cacert /etc/elasticsearch/certs/http_ca.crt https://127.0.0.1:9200/.ds-metricbeat-8.5.0-2022.11.09-000001/_search?pretty
Enter host password for user 'elastic'
{
  "took" : 2,
  "timed_out" : false,
  "_shards" : {
    "total" : 1,
    "successful" : 1,
    "skipped" : 0,
    "failed" : 0
  },
  "hits" : {
    "total" : {
      "value" : 6526,
      "relation" : "eq"
    },
    "max_score" : 1.0,
    "hits" : [
      {
        "_index" : ".ds-metricbeat-8.5.0-2022.11.09-000001",
        "_id" : "aUMPW4QBQ1Dwm2jJ_ye1",
        "_score" : 1.0,
        "_source" : {
          "@timestamp" : "2022-11-09T06:24:45.003Z",
          "system" : {
            "load" : {
              "15" : 0.06,
              "norm" : {
                "1" : 0.09,
                "5" : 0.075,
                "15" : 0.03
.....
.....
|
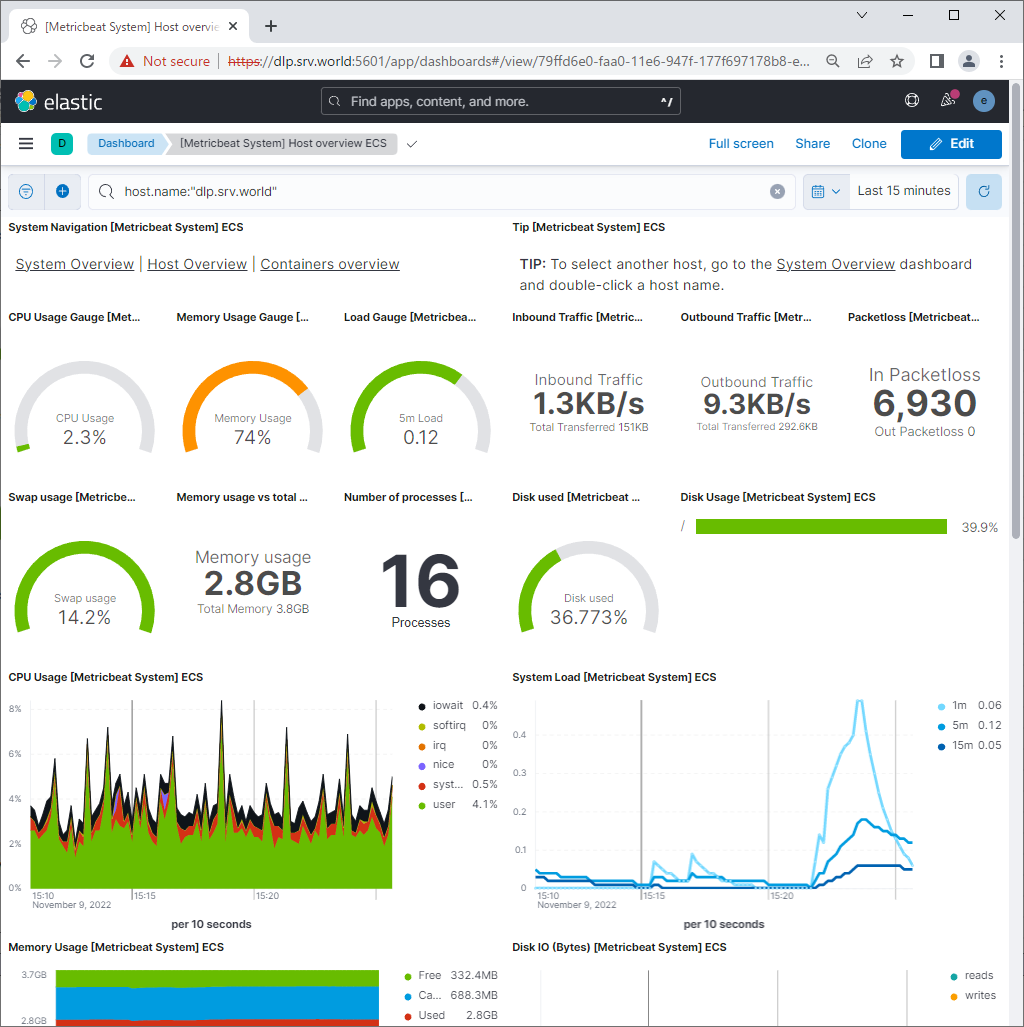
| [4] | Kibana を稼働させている場合は、サンプルダッシュボードへのデータインポートが可能です。 |
|
root@dlp:~# metricbeat setup --dashboards Loading dashboards (Kibana must be running and reachable) Loaded dashboards |
|
関連コンテンツ