Prometheus : インストール2018/12/11 |
|
監視システム Prometheus をインストールして設定します。
Prometheus サーバーから監視対象ノードにアクセスしてデータを取得する Pull 型のアーキテクチャーを採用しています。 また、外部データベースは不要で Prometheus サーバー上に時系列データが保存されます。
Prometheus のアーキテクチャー概要は公式サイトを参照ください。
⇒ https://prometheus.io/docs/introduction/overview/ |
|
| [1] | Prometheus サーバー機能がふくまれる [prometheus] パッケージ、および CPU やメモリーなどの一般的なシステムリソースのデータを取得する [prometheus-node-exporter] パッケージをインストールします。 |
|
root@dlp:~# apt -y install prometheus prometheus-node-exporter |
| [2] | 基本的な設定は prometheus.yml で実施します。 |
|
# 基本的な設定は下記ファイルで実施 # 変更なしのデフォルト状態でもローカルリソースのデータは取得される # 当例では一旦デフォルトのまま進める root@dlp:~# vi /etc/prometheus/prometheus.yml
global:
  scrape_interval:     15s # By default, scrape targets every 15 seconds.
  evaluation_interval: 15s # By default, scrape targets every 15 seconds.
  # scrape_timeout is set to the global default (10s).

  # Attach these labels to any time series or alerts when communicating with
  # external systems (federation, remote storage, Alertmanager).
  external_labels:
      monitor: 'example'

# Load and evaluate rules in this file every 'evaluation_interval' seconds.
rule_files:
  # - "first.rules"
  # - "second.rules"

# A scrape configuration containing exactly one endpoint to scrape:
# Here it's Prometheus itself.
scrape_configs:
  # The job name is added as a label `job=<job_name>` to any timeseries scraped from this config.
  - job_name: 'prometheus'

    # Override the global default and scrape targets from this job every 5 seconds.
    scrape_interval: 5s
    scrape_timeout: 5s

    # metrics_path defaults to '/metrics'
    # scheme defaults to 'http'.

    static_configs:
      - targets: ['localhost:9090']

  - job_name: node
    # If prometheus-node-exporter is installed, grab stats about the local
    # machine by default.
    static_configs:
      - targets: ['localhost:9100']
# Prometheus サービスは [prometheus(.service)] root@dlp:~# systemctl restart prometheus
|
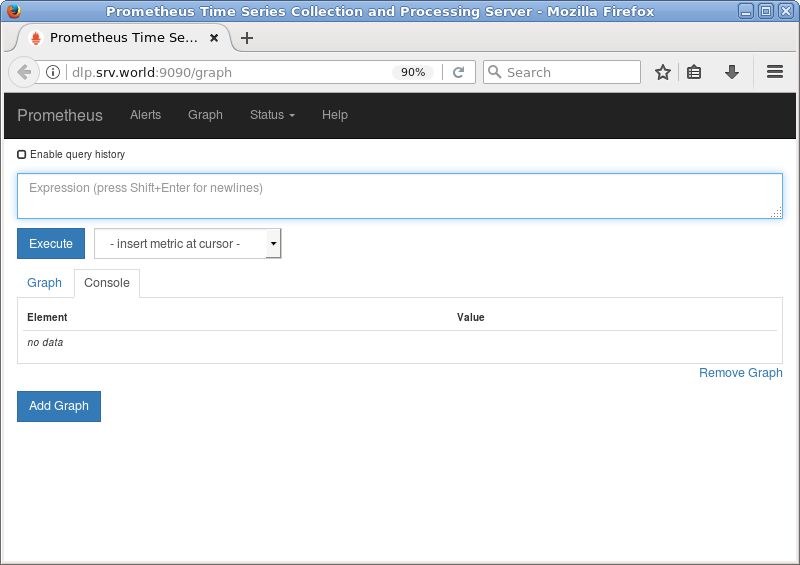
| [3] | 任意のクライアントホストで Web ブラウザーを起動し、[http://(サーバーのホスト名 または IPアドレス):9090/] へアクセスします。 すると、Prometheus Web UI の画面が表示されます。 |
|
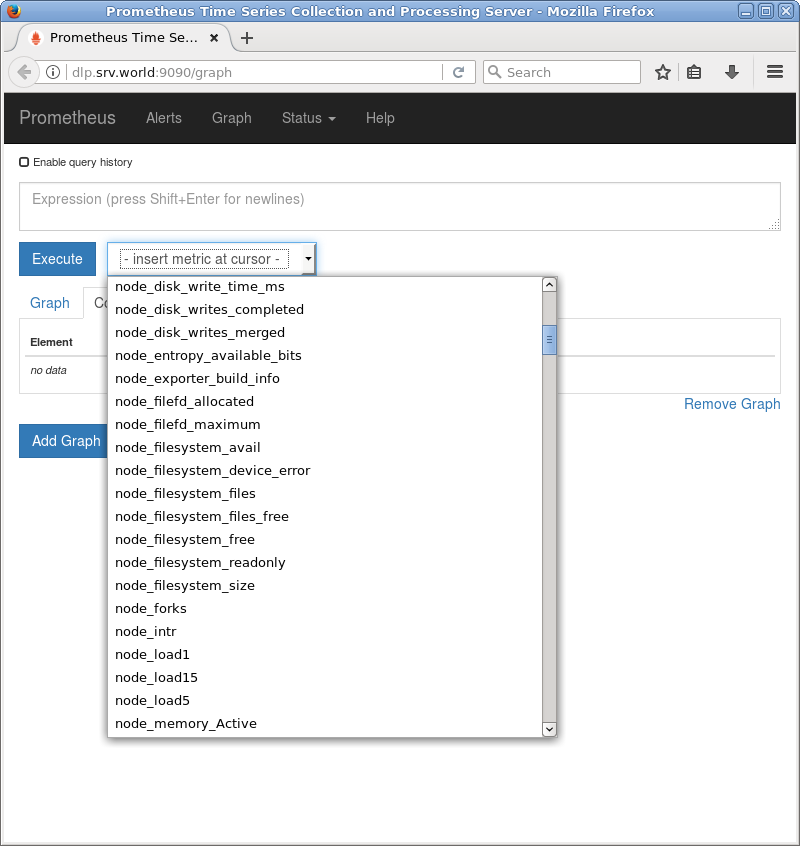
| [4] |
[insert metric at cursor] をクリックすると、保存された時系列データが参照可能な様々なクエリーが用意されています。
クエリーは上部の入力フィールドから直接記述することも可能で、Prometheus 独自の Expression Language 機能です。
Expression Language の使用例は公式サイトを参照ください。⇒ https://prometheus.io/docs/querying/examples/ |
|
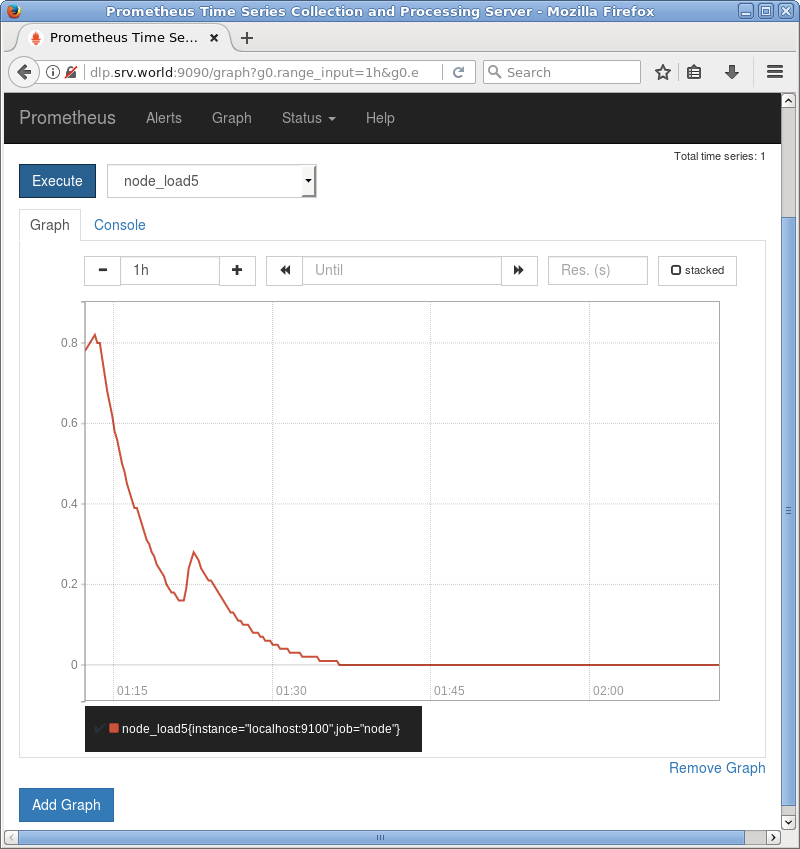
| [5] | [node_load5] を実行した様子です。 |
|
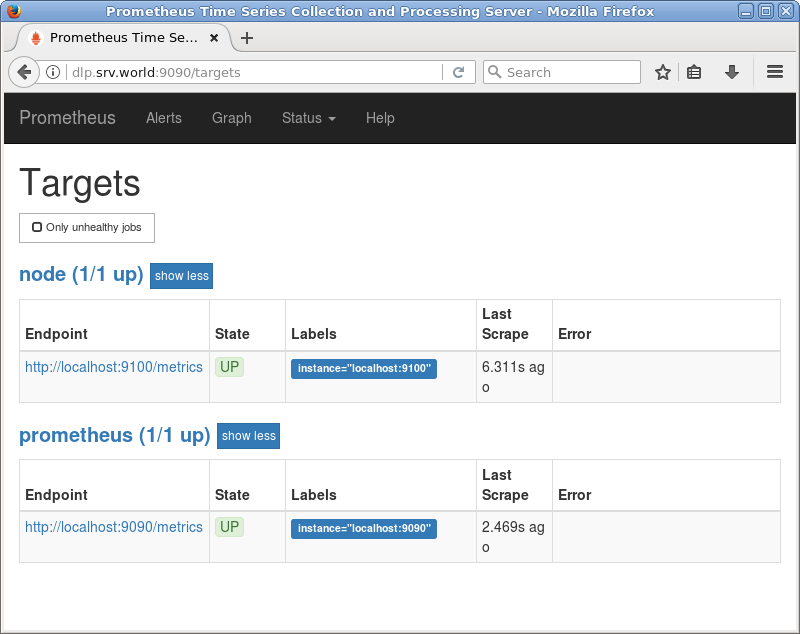
| [6] | [Status] - [Targets] をクリックすると、各ノードのステータスが確認できます。 |
|
関連コンテンツ