MicroK8s : Prometheus を有効にする2021/08/30 |
|
Prometheus アドオンを有効にして、Prometheus による MicroK8s クラスターの各種メトリクスの収集を行います。
|
| [1] | プライマリーノードで、Prometheus アドオンを有効にします。 |
|
root@dlp:~# microk8s enable prometheus dashboard dns Adding argument --authentication-token-webhook to nodes. Adding argument --authentication-token-webhook to nodes. Restarting nodes. Restarting nodes. Addon dns is already enabled. ..... ..... servicemonitor.monitoring.coreos.com/kube-scheduler created servicemonitor.monitoring.coreos.com/kubelet created The Prometheus operator is enabled (user/pass: admin/admin) Addon dashboard is already enabled. Addon dns is already enabled.root@dlp:~# microk8s kubectl get services -n monitoring NAME TYPE CLUSTER-IP EXTERNAL-IP PORT(S) AGE prometheus-operator ClusterIP None <none> 8443/TCP 79s alertmanager-main ClusterIP 10.152.183.105 <none> 9093/TCP 75s grafana ClusterIP 10.152.183.234 <none> 3000/TCP 74s kube-state-metrics ClusterIP None <none> 8443/TCP,9443/TCP 74s node-exporter ClusterIP None <none> 9100/TCP 74s prometheus-adapter ClusterIP 10.152.183.193 <none> 443/TCP 74s prometheus-k8s ClusterIP 10.152.183.24 <none> 9090/TCP 74sroot@dlp:~# microk8s kubectl get pods -n monitoring NAME READY STATUS RESTARTS AGE grafana-6b8df57c5b-vkcfd 1/1 Running 0 99s prometheus-adapter-69b8496df6-6lmr4 1/1 Running 0 99s prometheus-operator-7649c7454f-pdwhc 2/2 Running 0 99s kube-state-metrics-78dc55b74b-2klfw 3/3 Running 0 99s node-exporter-xx6ch 2/2 Running 0 98s alertmanager-main-0 2/2 Running 0 73s prometheus-k8s-0 2/2 Running 1 73s # 外部からもアクセスできるようにポートフォワードする # Prometheus UI root@dlp:~# microk8s kubectl port-forward -n monitoring service/prometheus-k8s --address 0.0.0.0 9090:9090 Forwarding from 0.0.0.0:9090 -> 9090 # Grafana UI root@dlp:~# microk8s kubectl port-forward -n monitoring service/grafana --address 0.0.0.0 3000:3000 Forwarding from 0.0.0.0:3000 -> 3000 |
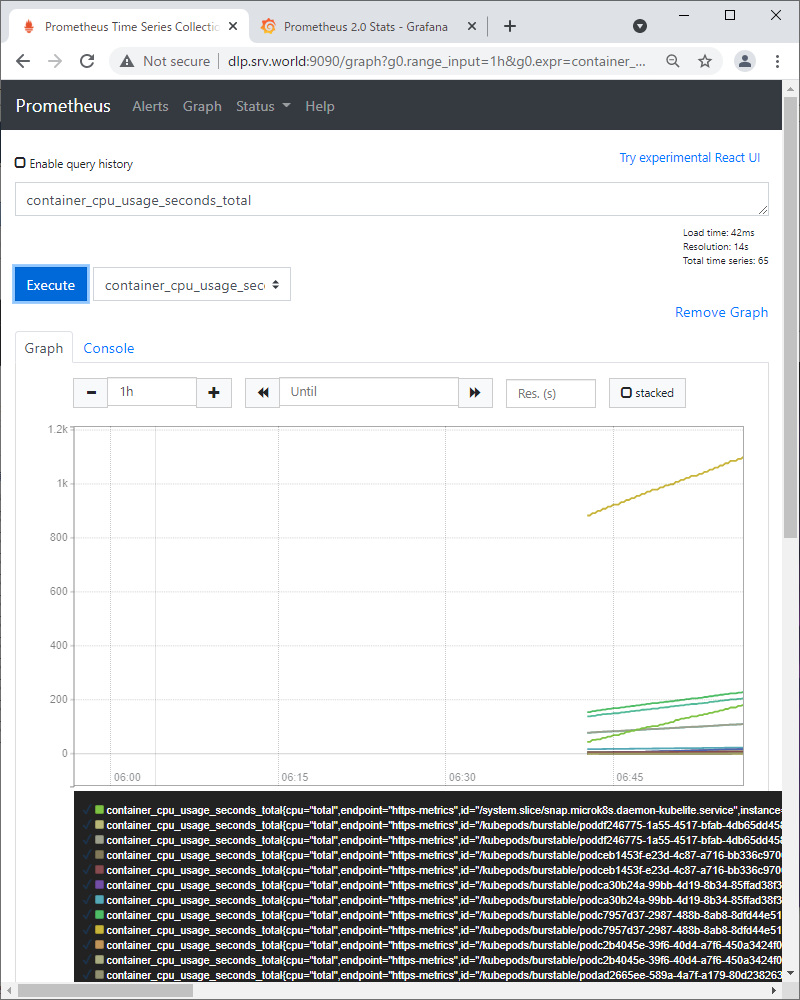
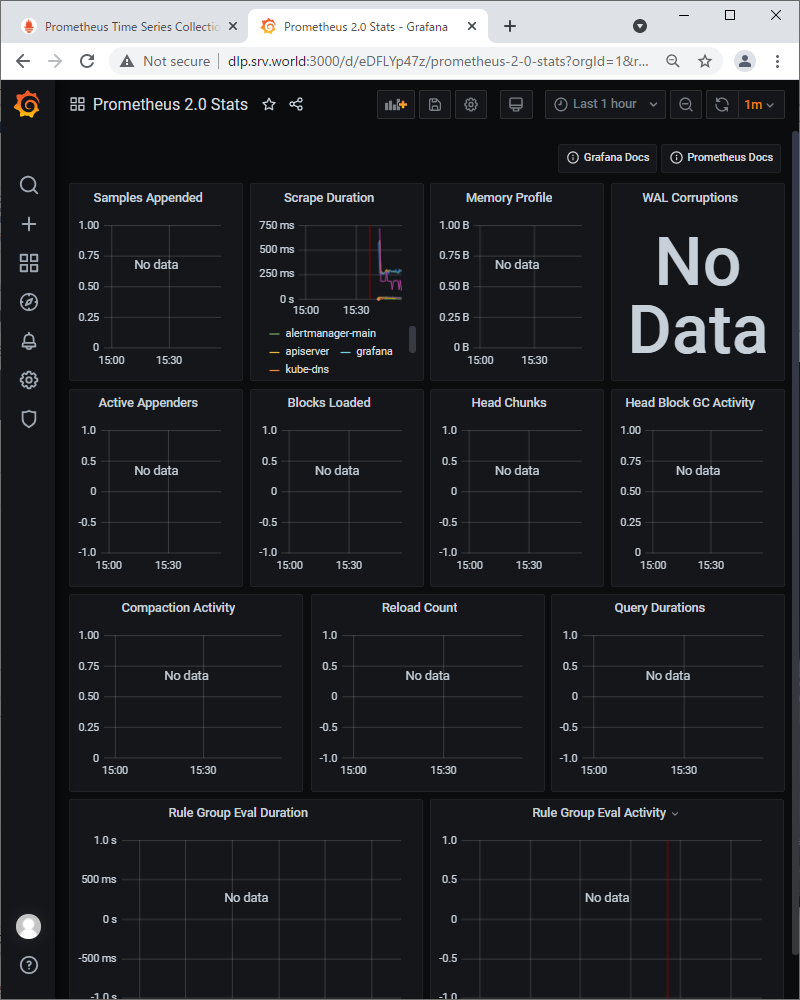
| [2] | ローカルネットワーク内の任意のクライアントコンピューターで Web
ブラウザーを起動し、[http://(MicroK8s プライマリーノードのホスト名 または IP アドレス):(設定したポート)/]
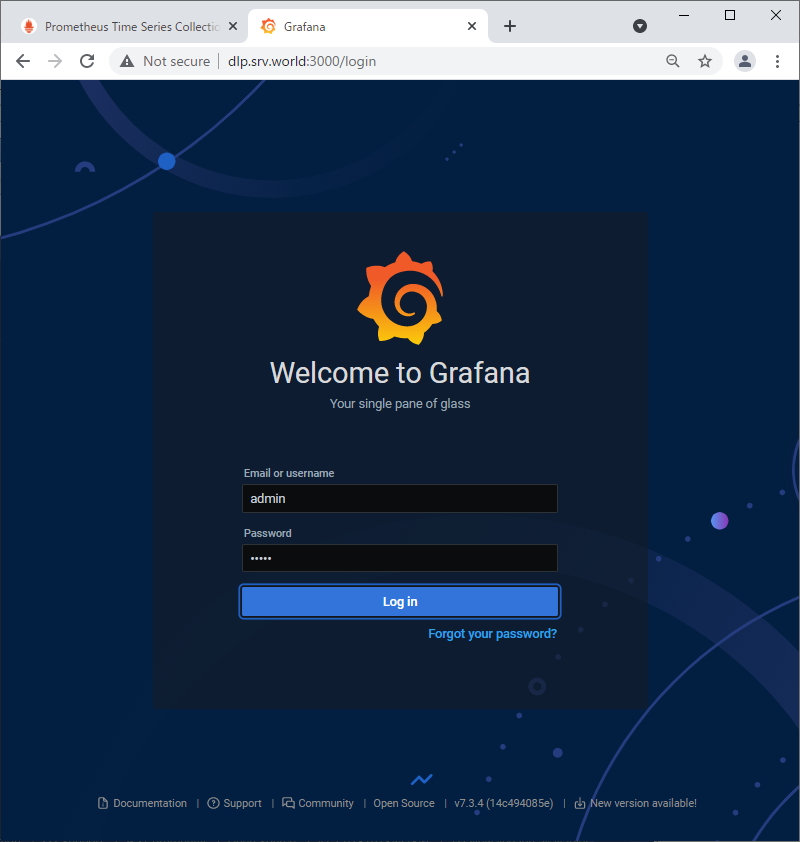
にアクセスして、Prometheus や Grafana の UI が表示されれば OK です。 なお、Grafana の [デフォルトユーザー/パスワード] は [admin/admin] です。ログイン後、直ちにパスワード変更を求められます。 |
|
|
|
関連コンテンツ