MicroK8s : Enable Prometheus2022/09/02 |
|
Enable Prometheus add-on to monitor metrics on MicroK8s Cluster.
|
| [1] | Enable built-in Prometheus add-on on primary Node. |
|
root@dlp:~# microk8s enable prometheus dashboard dns Infer repository core for addon prometheus Infer repository core for addon dashboard Infer repository core for addon dns Adding argument --authentication-token-webhook to nodes. Configuring node 10.0.0.51 Restarting nodes. Configuring node 10.0.0.51 Infer repository core for addon dns Addon core/dns is already enabled Fetching kube-prometheus version v0.8.0. ..... ..... service/prometheus-k8s created serviceaccount/prometheus-k8s created servicemonitor.monitoring.coreos.com/prometheus-k8s created The Prometheus operator is enabled (user/pass: admin/admin) Addon core/dashboard is already enabled Addon core/dns is already enabledroot@dlp:~# microk8s kubectl get services -n monitoring NAME TYPE CLUSTER-IP EXTERNAL-IP PORT(S) AGE prometheus-operator ClusterIP None <none> 8443/TCP 2m2s alertmanager-main ClusterIP 10.152.183.64 <none> 9093/TCP 118s blackbox-exporter ClusterIP 10.152.183.133 <none> 9115/TCP,19115/TCP 118s grafana ClusterIP 10.152.183.24 <none> 3000/TCP 117s kube-state-metrics ClusterIP None <none> 8443/TCP,9443/TCP 117s node-exporter ClusterIP None <none> 9100/TCP 117s prometheus-adapter ClusterIP 10.152.183.96 <none> 443/TCP 117s prometheus-k8s ClusterIP 10.152.183.120 <none> 9090/TCP 116s alertmanager-operated ClusterIP None <none> 9093/TCP,9094/TCP,9094/UDP 53s prometheus-operated ClusterIP None <none> 9090/TCP 52sroot@dlp:~# microk8s kubectl get pods -n monitoring NAME READY STATUS RESTARTS AGE prometheus-adapter-85455b9f55-jd8q2 1/1 Running 0 2m4s node-exporter-pknj4 2/2 Running 0 2m4s grafana-789464df6b-svscm 1/1 Running 0 2m4s prometheus-operator-65cdb77c59-76gs8 2/2 Running 0 2m4s prometheus-adapter-85455b9f55-v4pm7 1/1 Running 0 2m4s blackbox-exporter-84c68b59b8-8hrvz 3/3 Running 0 2m4s node-exporter-g48jm 2/2 Running 0 2m4s kube-state-metrics-55b87f58f6-bqzgk 3/3 Running 0 2m4s alertmanager-main-0 2/2 Running 0 113s prometheus-k8s-0 2/2 Running 1 (83s ago) 112s # set port-forwarding to enable external access if you need # Prometheus UI root@dlp:~# microk8s kubectl port-forward -n monitoring service/prometheus-k8s --address 0.0.0.0 9090:9090 Forwarding from 0.0.0.0:9090 -> 9090 # Grafana UI root@dlp:~# microk8s kubectl port-forward -n monitoring service/grafana --address 0.0.0.0 3000:3000 Forwarding from 0.0.0.0:3000 -> 3000 |
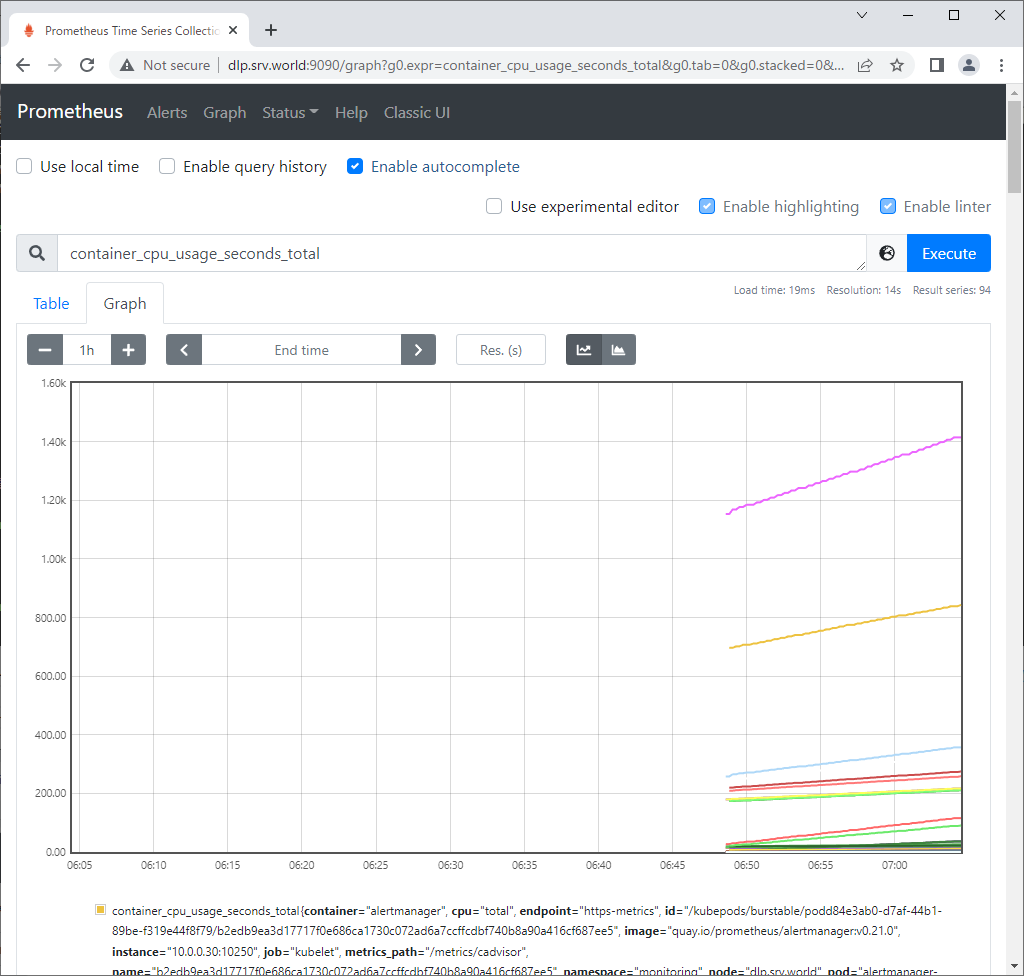
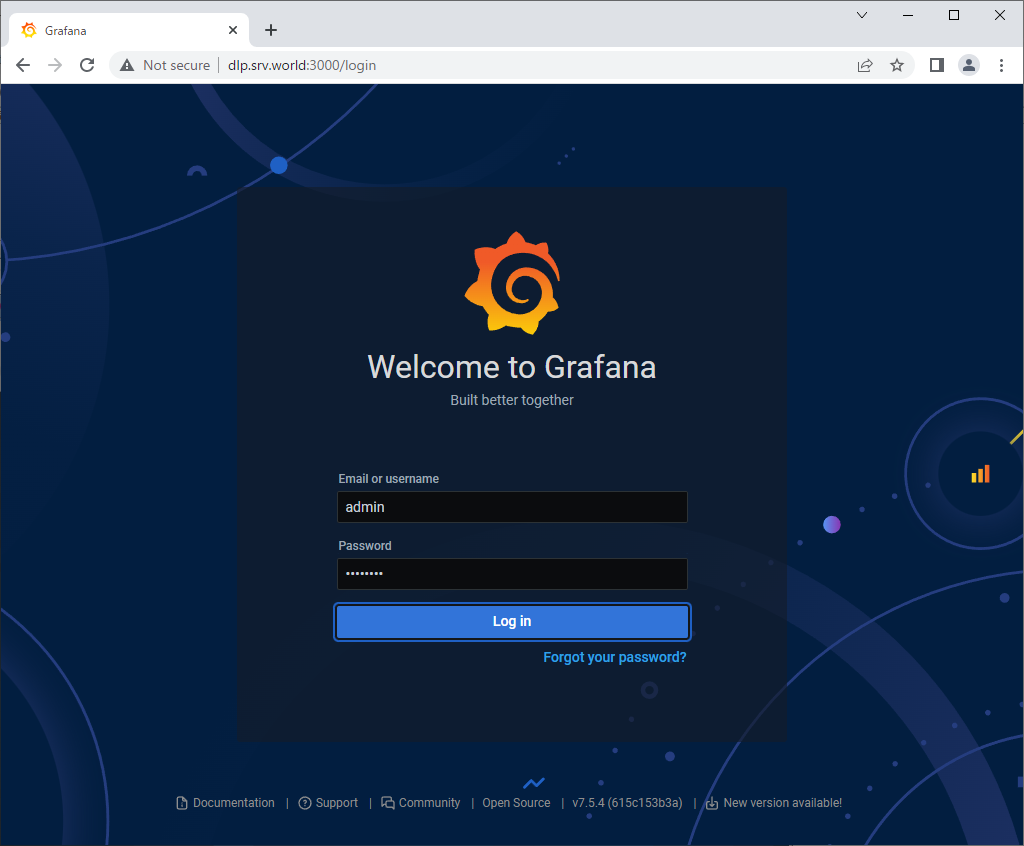
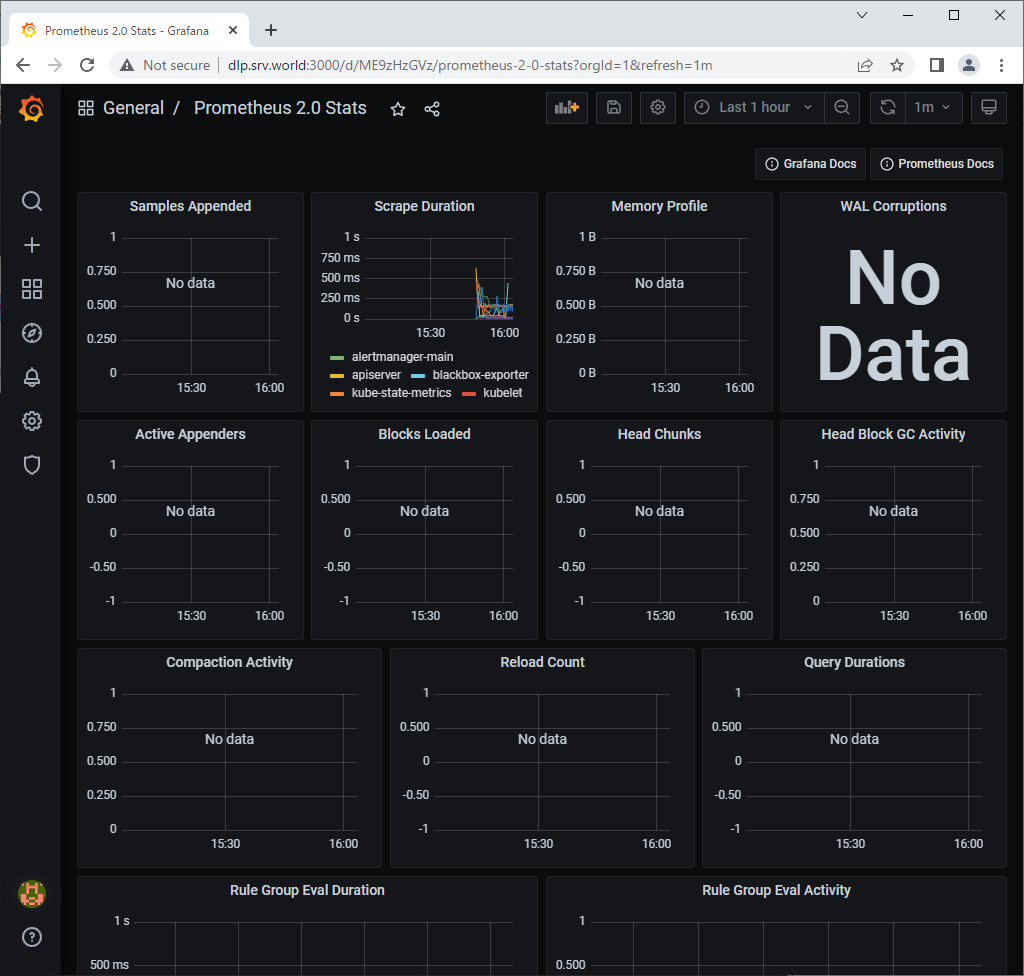
| [2] | Access to [https://(MicroK8s primary node's Hostname or IP address):(setting port)] with an web browser
on a Client computer in local network. Then, that's OK if following Prometheus or Grafana UI is shown. For default user/password on Grafana, it [admin/admin]. |
|
|
|
Matched Content