MicroK8s : Enable Prometheus2021/05/13 |
|
Enable Prometheus add-on to monitor metrics on MicroK8s Cluster.
|
| [1] | Enable built-in Prometheus add-on on primary Node. |
|
root@dlp:~# microk8s enable prometheus dashboard dns Adding argument --authentication-token-webhook to nodes. Adding argument --authentication-token-webhook to nodes. Restarting nodes. Restarting nodes. ..... ..... servicemonitor.monitoring.coreos.com/coredns created servicemonitor.monitoring.coreos.com/kube-controller-manager created servicemonitor.monitoring.coreos.com/kube-scheduler created servicemonitor.monitoring.coreos.com/kubelet created The Prometheus operator is enabled (user/pass: admin/admin) Addon dashboard is already enabled. Addon dns is already enabled.root@dlp:~# microk8s kubectl get services -n monitoring NAME TYPE CLUSTER-IP EXTERNAL-IP PORT(S) AGE prometheus-operator ClusterIP None <none> 8443/TCP 2m25s alertmanager-main ClusterIP 10.152.183.201 <none> 9093/TCP 2m21s grafana ClusterIP 10.152.183.150 <none> 3000/TCP 2m21s kube-state-metrics ClusterIP None <none> 8443/TCP,9443/TCP 2m20s node-exporter ClusterIP None <none> 9100/TCP 2m20s prometheus-adapter ClusterIP 10.152.183.64 <none> 443/TCP 2m20s prometheus-k8s ClusterIP 10.152.183.144 <none> 9090/TCP 2m20s alertmanager-operated ClusterIP None <none> 9093/TCP,9094/TCP,9094/UDP 64s prometheus-operated ClusterIP None <none> 9090/TCP 64sroot@dlp:~# microk8s kubectl get pods -n monitoring NAME READY STATUS RESTARTS AGE node-exporter-8k82h 2/2 Running 0 3m2s kube-state-metrics-54d8bdf4db-sljxk 3/3 Running 0 3m2s grafana-7c9bc466d8-mxhbt 1/1 Running 0 3m2s prometheus-adapter-557648f58c-glj7n 1/1 Running 0 3m3s prometheus-operator-58fc7fbbd-v8r22 2/2 Running 0 3m7s alertmanager-main-0 2/2 Running 0 107s prometheus-k8s-0 3/3 Running 1 107s # set port-forwarding to enable external access # Prometheus UI root@dlp:~# microk8s kubectl port-forward -n monitoring service/prometheus-k8s --address 0.0.0.0 9090:9090 Forwarding from 0.0.0.0:9090 -> 9090 # Grafana UI root@dlp:~# microk8s kubectl port-forward -n monitoring service/grafana --address 0.0.0.0 3000:3000 Forwarding from 0.0.0.0:3000 -> 3000 |
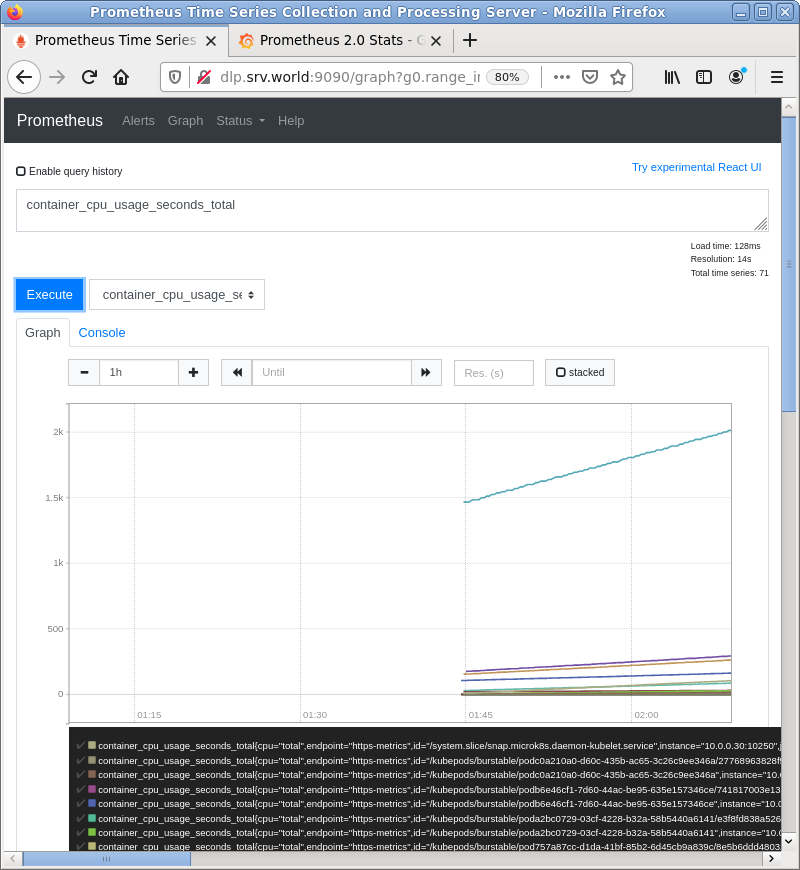
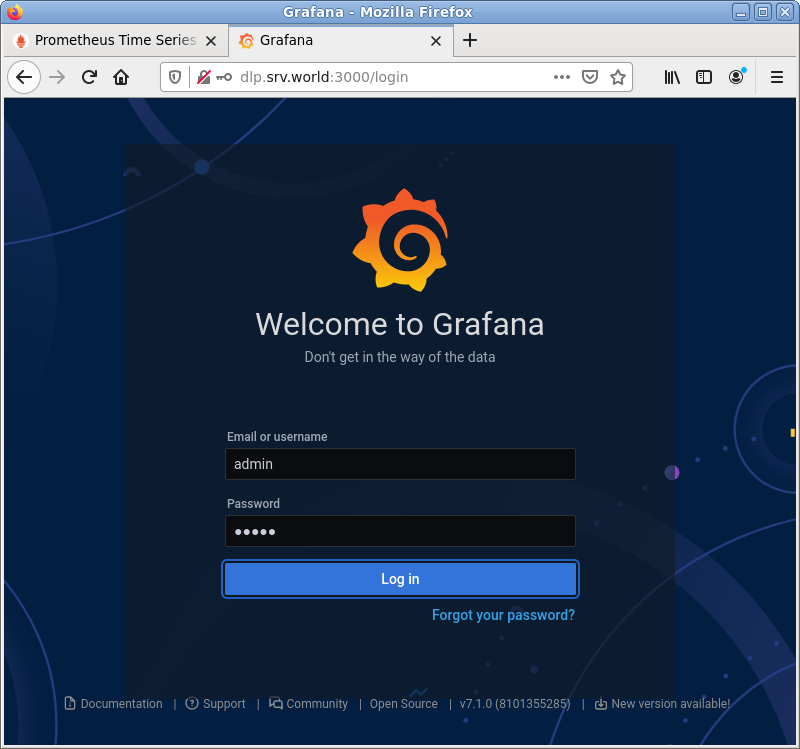
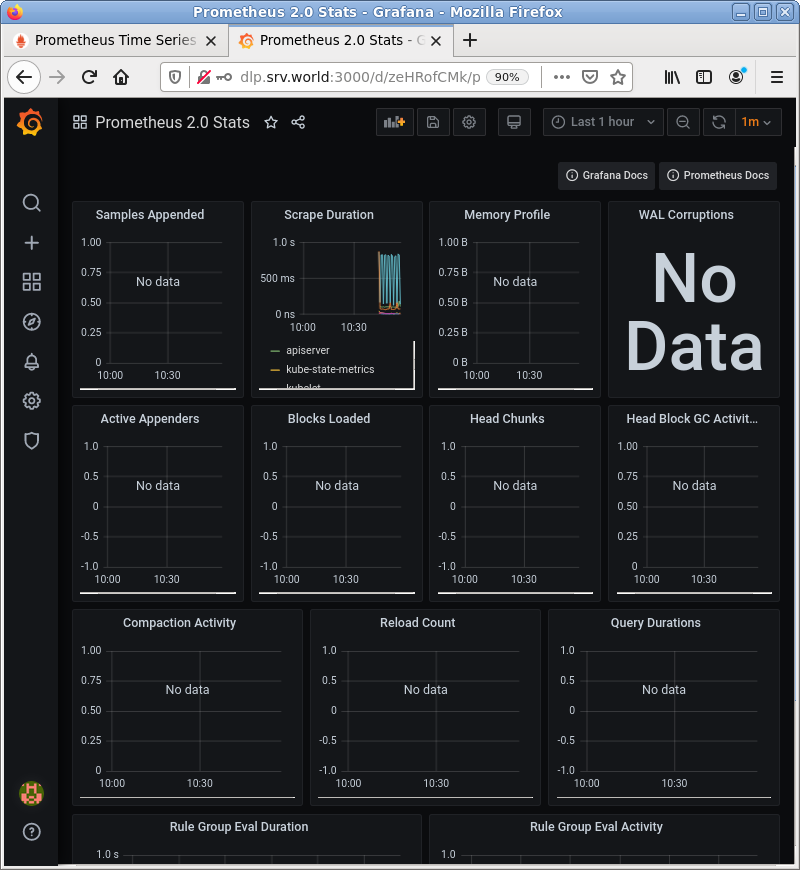
| [2] | Access to [https://(MicroK8s primary node's Hostname or IP address):(setting port)] with an web browser
on a Client computer in local network. Then, that's OK if following Prometheus or Grafana UI is shown. For default user/password on Grafana, it [admin/admin]. |
|
|
|
Matched Content