Prometheus : Add Monitoring Target2020/09/07 |
|
Add Monitoring Target Nodes.
|
|
| [1] | Install [node-exporter] package on the Node you'd like to add that includes features to get metric data of general resource on the System like CPU or Memory usage. |
|
root@node01:~# apt -y install prometheus-node-exporter
|
| [2] | Add setting on Prometheus Server Configuration. |
|
root@dlp:~#
vi /etc/prometheus/prometheus.yml
.....
.....
scrape_configs:
  # The job name is added as a label `job=<job_name>` to any timeseries scraped from this config.
  - job_name: 'prometheus'

    # metrics_path defaults to '/metrics'
    # scheme defaults to 'http'.

    static_configs:
    - targets: ['localhost:9090']

  # line 33: add new Host to [targets] line
    - job_name: node
    static_configs:
      - targets: ['localhost:9100', 'node01.srv.world:9100']

  # alternatively, if you'd like to add to another group,
  # add [job_name] section like follows
  # any name is OK for [job_name]
  - job_name: Hiroshima
    static_configs:
      - targets: ['node01.srv.world:9100']
root@dlp:~# systemctl restart prometheus
|
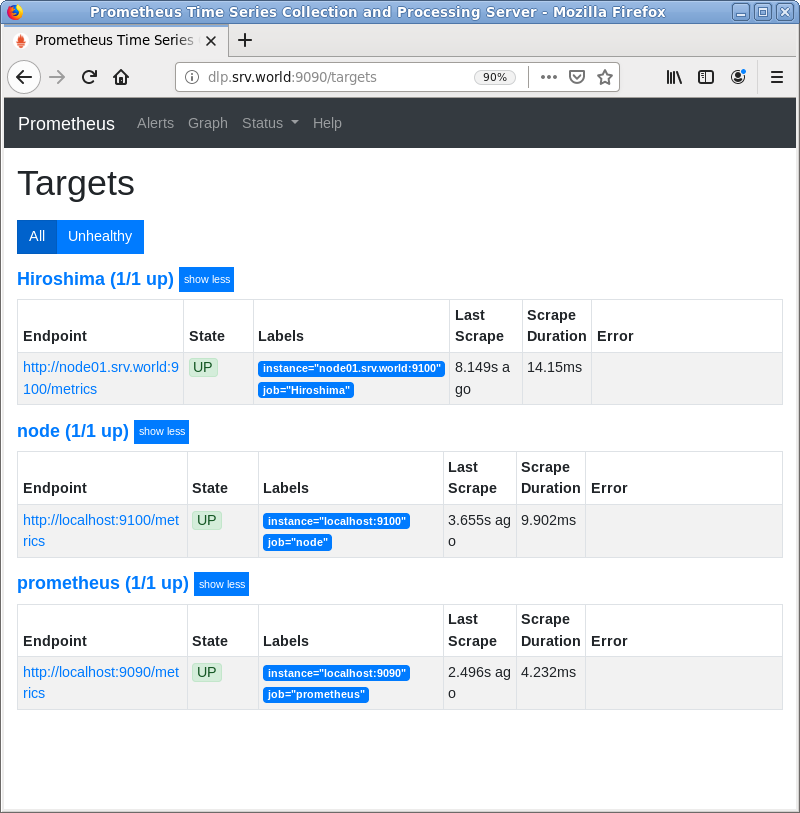
| [3] | Access to the Prometheus Web UI and click [Status] - [Targets] to verify new nodes are listed. |
|
|
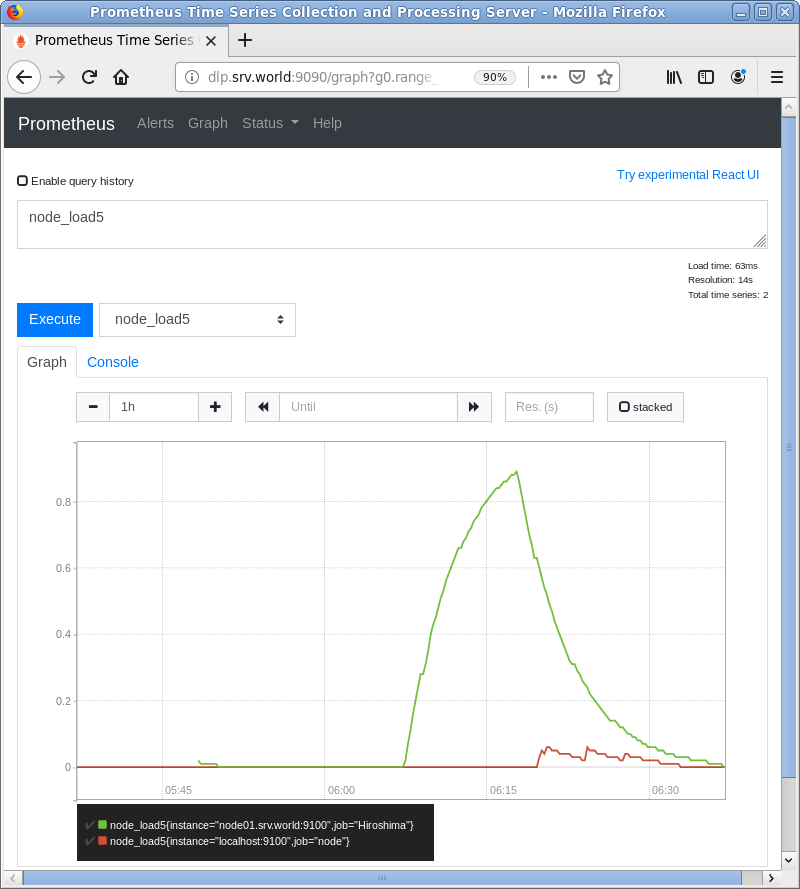
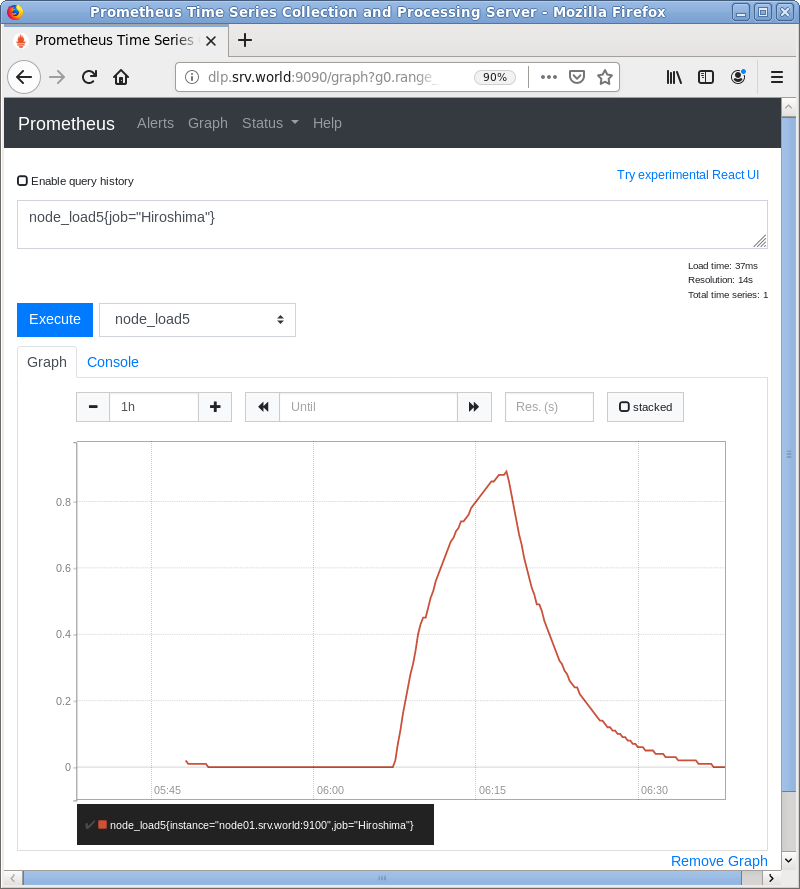
| [4] | To input query directly, it's possbile to display specific Job or Node. The example below shows a Job for [node_load5]. ⇒ node_load5{job="Hirosima"} |
|
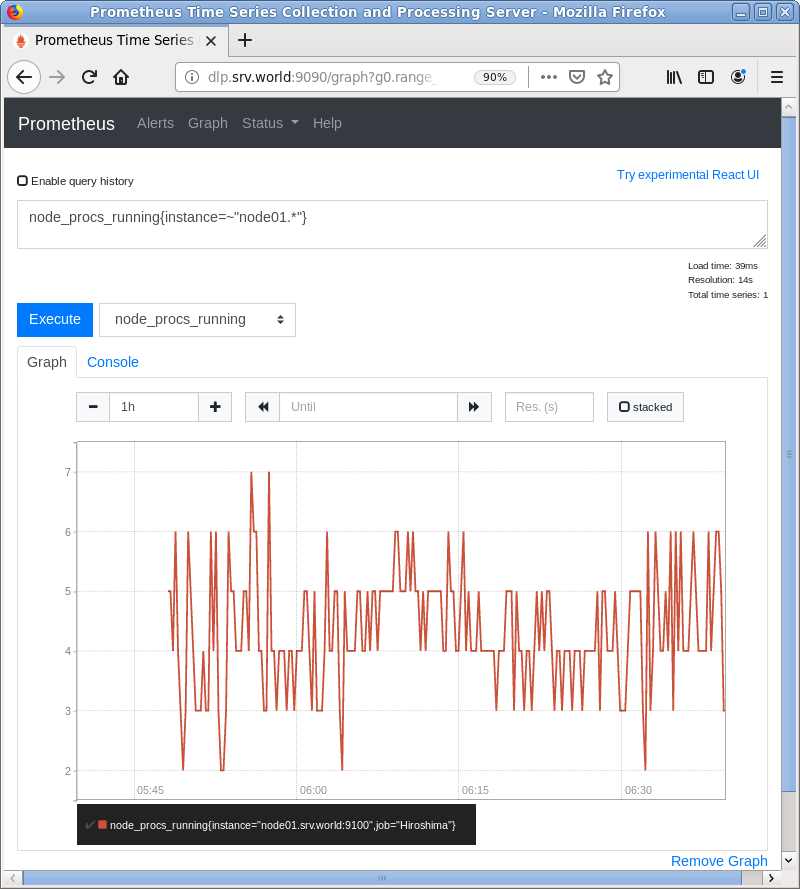
| [5] | The example below shows a Node for [node_procs_running]. ⇒ node_procs_running{instance=~"node01.*"} |
|
Matched Content