Prometheus : Add Target Hosts2018/12/11 |
|
Add Target Hosts to monitor more nodes.
|
|
| [1] | Install [prometheus-node-exporter] package that includes function to get general resource on the System like CPU or Memory usage on the Node you'd like to add. |
|
root@node01:~#
apt -y install prometheus-node-exporter # service daemon is the [prometheus-node-exporter(.service)] root@node01:~# systemctl status prometheus-node-exporter
*  prometheus-node-exporter.service - Prometheus exporter for machine metrics
   Loaded: loaded (/lib/systemd/system/prometheus-node-exporter.service; enabled
   Active: active (running) since Tue 2018-12-11 19:20:46 JST; 50s ago
     Docs: https://github.com/prometheus/node_exporter
 Main PID: 1377 (prometheus-node)
    Tasks: 4 (limit: 4663)
   CGroup: /system.slice/prometheus-node-exporter.service
           +--377 /usr/bin/prometheus-node-exporter --collector.diskstats.ignore
|
| [2] | Add setting on Prometheus Server Config. |
|
root@dlp:~#
vi /etc/prometheus/prometheus.yml # line 38: add new nodes in [targets] section - job_name: node # If prometheus-node-exporter is installed, grab stats about the local # machine by default. static_configs: - targets: ['localhost:9100', 'node01.srv.world:9100'] # if adding other group, add [job_name] section like follows # any name is OK for [job_name] - job_name: Hiroshima static_configs: - targets: ['node02.srv.world:9100']root@dlp:~# systemctl restart prometheus
|
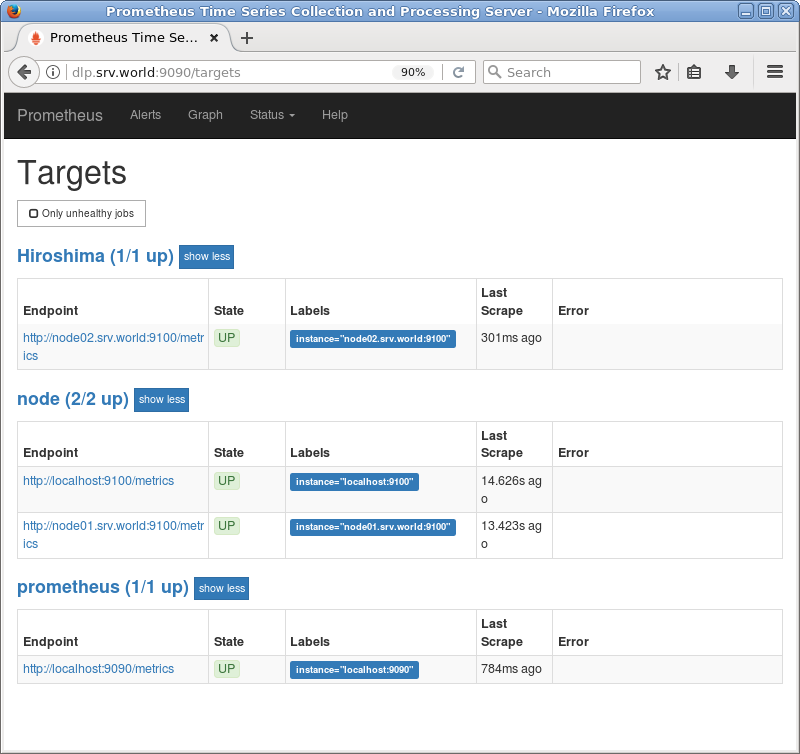
| [3] | Access to the Prometheus Web UI and click [Status] - [Targets] to verify new nodes are listed. |
|
|
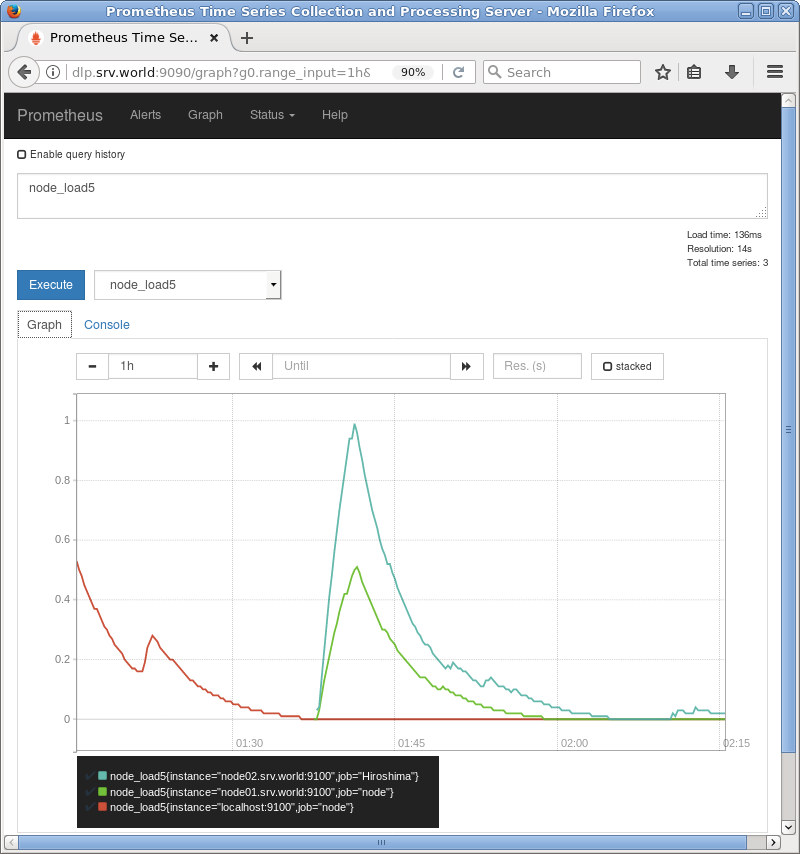
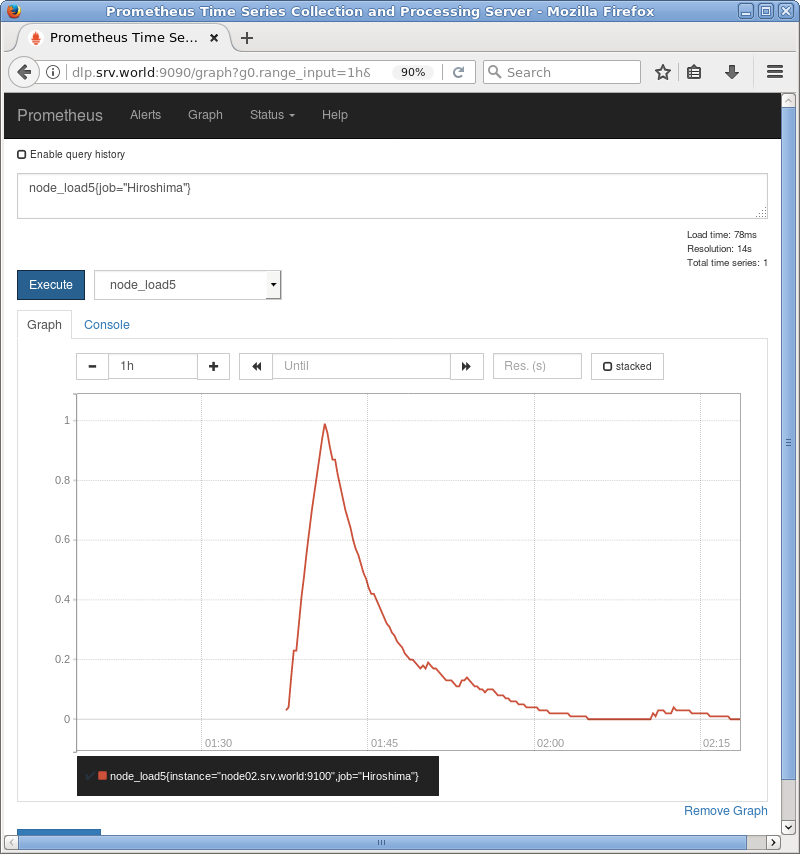
| [4] | To input query directly, it's possbile to display specific Job or Node. The example below shows a Job for node_load5. ⇒ node_load5{job="Hirosima"} |
|
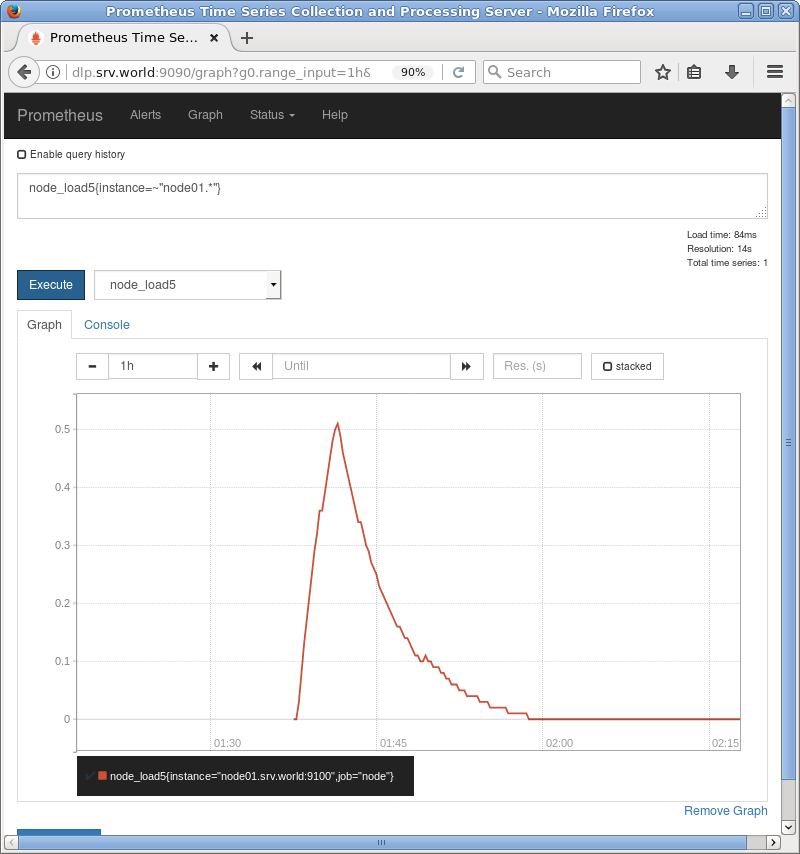
| [5] | The example below shows a Node for node_load5. ⇒ node_load5{instance=~"node01.*"} |
|
Matched Content