Prometheus : Install2018/12/11 |
|
Install Systems monitoring and Alerting toolkit "Prometheus".
Lern Overview about Prometheus on the pfficial site below. ⇒ https://prometheus.io/docs/introduction/overview/ |
|
| [1] | Install [prometheus] package that includes Prometheus Server function and [prometheus-node-exporter] package that includes function to get general resource on the System like CPU or Memory usage. |
|
root@dlp:~# apt -y install prometheus prometheus-node-exporter |
| [2] | Configure basic settings on prometheus.yml. |
|
# the default setting is like follows # on this example, keep default settings now root@dlp:~# vi /etc/prometheus/prometheus.yml
global:
  scrape_interval:     15s # By default, scrape targets every 15 seconds.
  evaluation_interval: 15s # By default, scrape targets every 15 seconds.
  # scrape_timeout is set to the global default (10s).

  # Attach these labels to any time series or alerts when communicating with
  # external systems (federation, remote storage, Alertmanager).
  external_labels:
      monitor: 'example'

# Load and evaluate rules in this file every 'evaluation_interval' seconds.
rule_files:
  # - "first.rules"
  # - "second.rules"

# A scrape configuration containing exactly one endpoint to scrape:
# Here it's Prometheus itself.
scrape_configs:
  # The job name is added as a label `job=<job_name>` to any timeseries scraped from this config.
  - job_name: 'prometheus'

    # Override the global default and scrape targets from this job every 5 seconds.
    scrape_interval: 5s
    scrape_timeout: 5s

    # metrics_path defaults to '/metrics'
    # scheme defaults to 'http'.

    static_configs:
      - targets: ['localhost:9090']

  - job_name: node
    # If prometheus-node-exporter is installed, grab stats about the local
    # machine by default.
    static_configs:
      - targets: ['localhost:9100']
# Prometheus service daemon is the [prometheus(.service)] root@dlp:~# systemctl restart prometheus
|
| [3] | Access to the [http://(Prometheus server's hostname or IP address):9090/] from a client host, Then, Prometheus Web UI is shown like follows. |
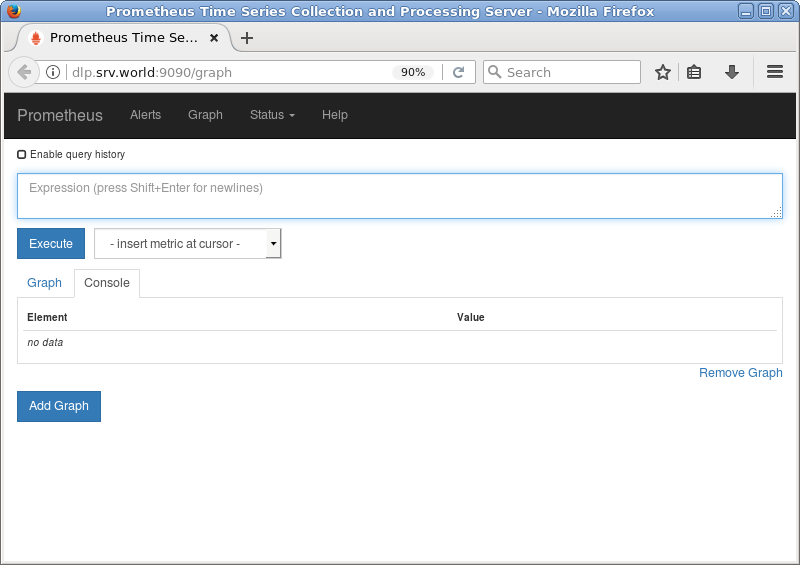
|
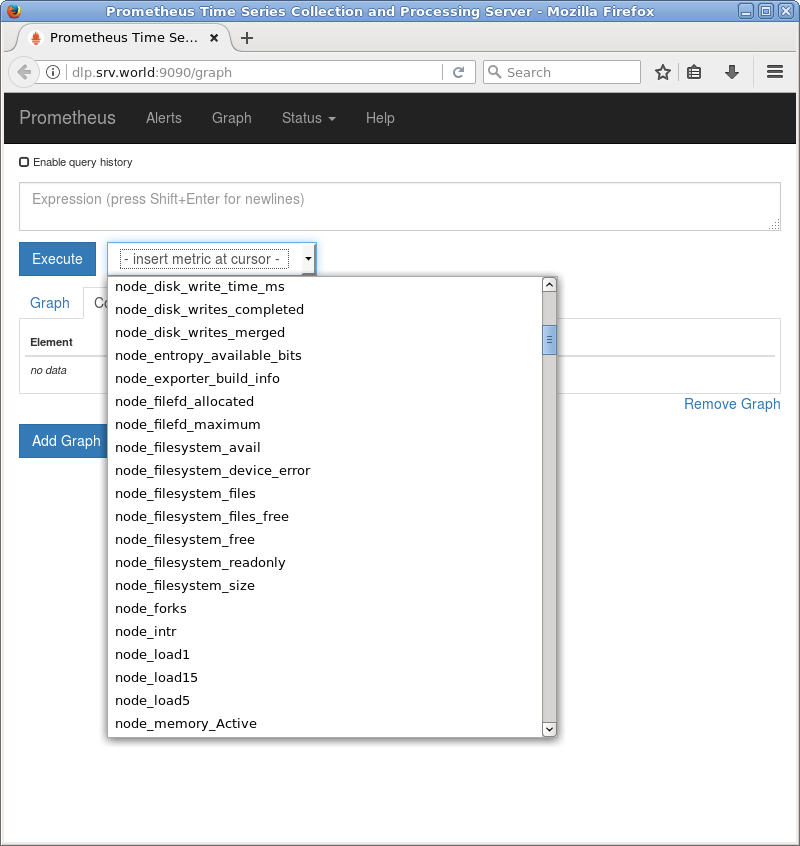
| [4] |
To click [insert metric at cursor], there are many queries to view time series data.
Refer to the official document about usage of Expression Language.It's also possible to input queries directly on the input form above, by Prometheus Expression Language. ⇒ https://prometheus.io/docs/querying/examples/ |
|
| [5] | This is the state of executing [node_load5]. |
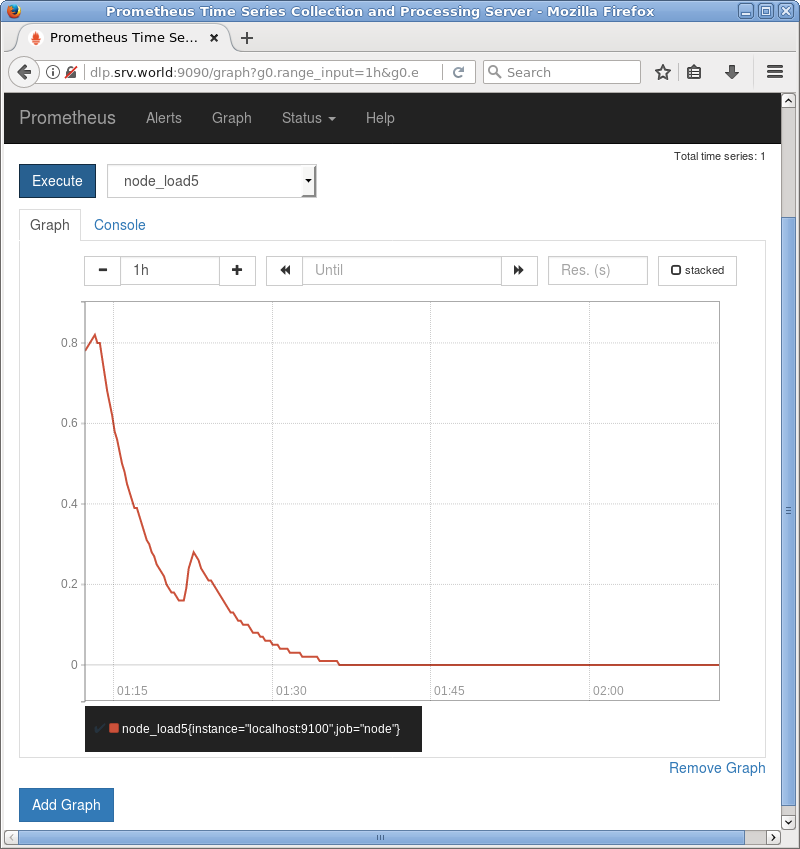
|
| [6] | To click [Status] - [Targets], possible to confrm status for each node. |
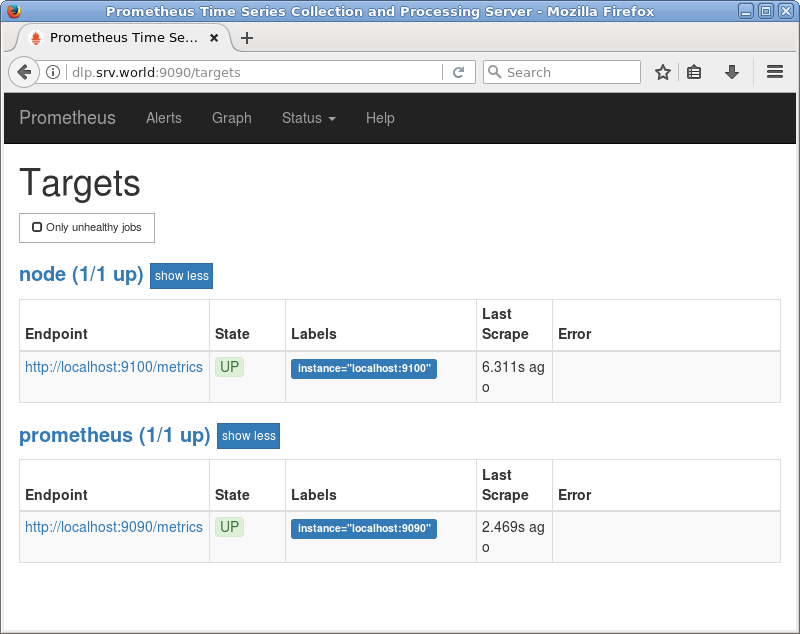
|
Matched Content