Grafana : Install2025/09/16 |
|
Install Web Dashboard tool, Grafana.
Grafana is the visualize tool, so it needs data source from Database System like |
|
| [1] | Install Grafana. |
|
root@dlp:~#
wget -q -O /usr/share/keyrings/grafana.key https://packages.grafana.com/gpg.key root@dlp:~# echo "deb [signed-by=/usr/share/keyrings/grafana.key] https://packages.grafana.com/oss/deb stable main" | tee -a /etc/apt/sources.list.d/grafana.list root@dlp:~# apt update root@dlp:~# apt -y install grafana
root@dlp:~#
vi /etc/grafana/grafana.ini # line 39 : specify protocol ⇒ possible to change to [https], [h2], [socket] protocol = http # line 45 : IP address Grafana listens ⇒ listens [0.0.0.0] with the default below ;http_addr = # line 48 : specify port ⇒ possible to change to other port ;http_port = 3000 # line 51 : specify domain name ⇒ possible to change to your domain name ;domain = localhost # line 74 : specify your certificate if you set [https] or [h2] for protocol # * it needs [grafana] user can read certificate and key cert_file = /etc/letsencrypt/live/dlp.srv.world/fullchain.pem cert_key = /etc/letsencrypt/live/dlp.srv.world/privkey.pem
systemctl restart grafana-server
|
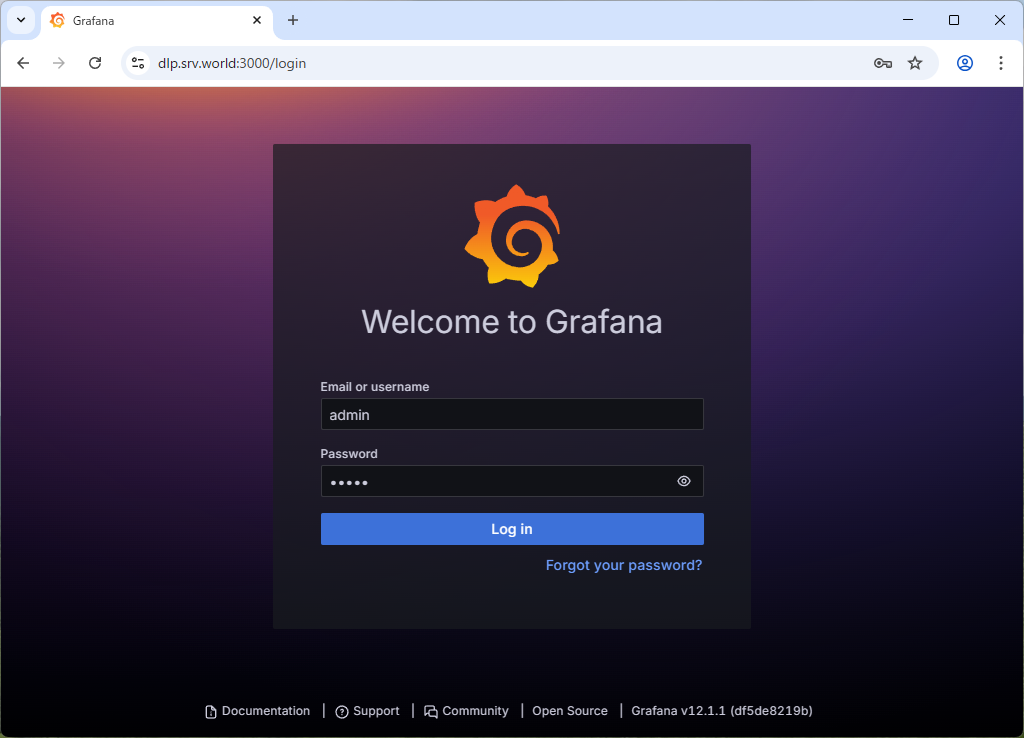
| [3] | Access to [http://(Grafana server's hostname or IP address):3000/] from any Clients with web browser, then, Grafana login form is shown like follows. It's possible to login with [admin] user and with the default password [admin]. |
|
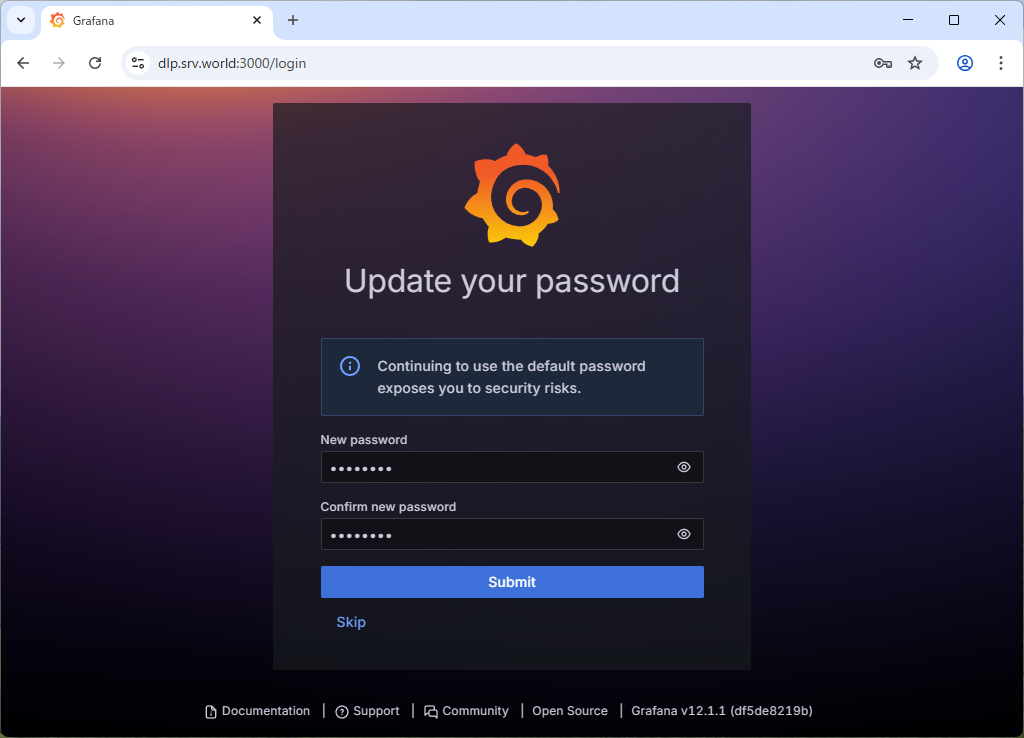
| [4] | When initial login, it needs to change admin password. Set any one and Click [Submit] button. |
|
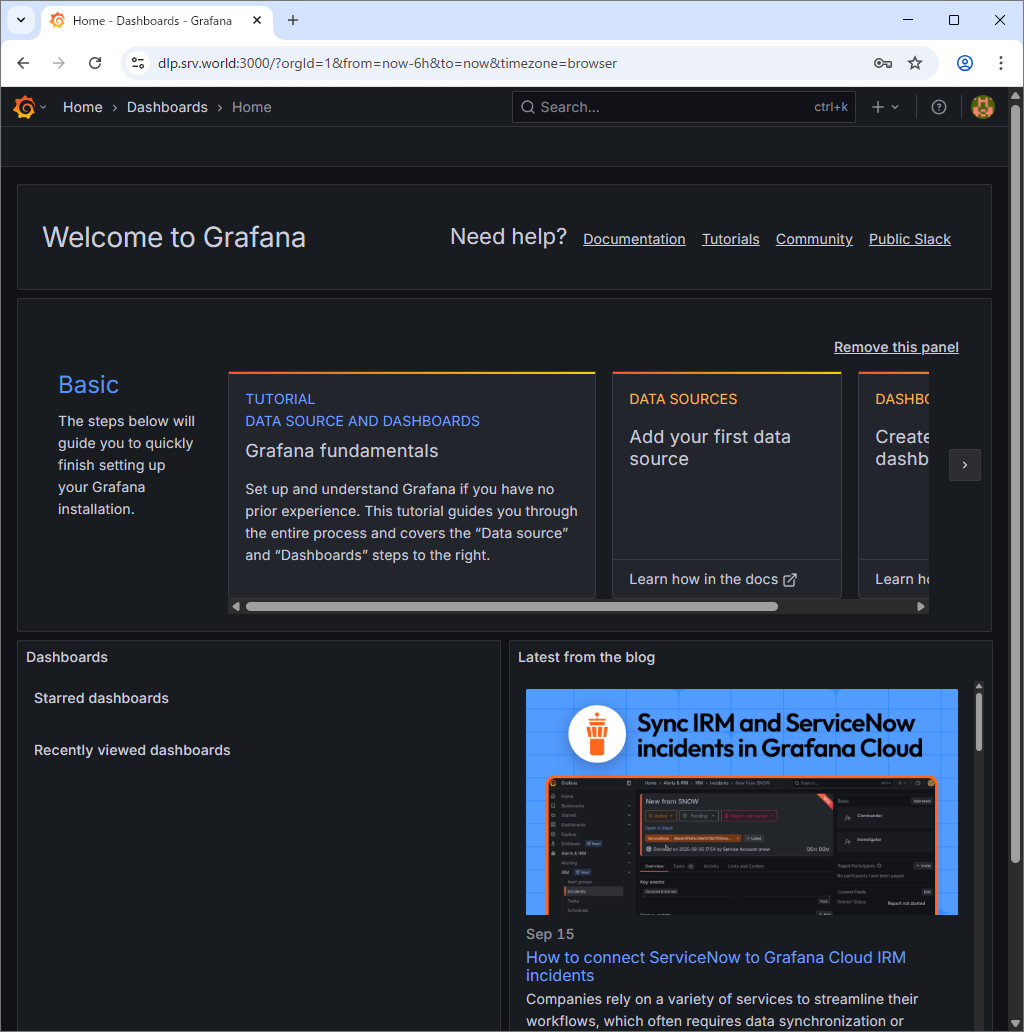
| [5] | After login normally, Grafana Home is shown. |
|
Matched Content