Kubernetes : Deploy Prometheus2023/07/28 |
|
Deploy Prometheus to monitor metrics in Kubernetes Cluster. This example is based on the environment like follows.
-----------+---------------------------+--------------------------+------------
           |                           |                          |
       eth0|10.0.0.25              eth0|10.0.0.71             eth0|10.0.0.72
+----------+-----------+   +-----------+-----------+   +-----------+-----------+
|  [ ctrl.srv.world ]  |   |  [snode01.srv.world]  |   |  [snode02.srv.world]  |
|     Control Plane    |   |      Worker Node      |   |      Worker Node      |
+----------------------+   +-----------------------+   +-----------------------+
|
| [1] |
A Persistent storage is needed for Prometheus.
On this example, install NFS Server on Control Plane Node and configure [/home/nfsshare] directory as NFS share as external persistent storage, and also configure dynamic volume provisioning with NFS plugin like the example of [1], [2], [3]. |
| [2] | Install Prometheus chart with Helm. |
|
# output config and change some settings root@ctrl:~# helm inspect values bitnami/kube-prometheus > prometheus.yaml
root@ctrl:~#
vi prometheus.yaml
.....
.....
    line 21 : specify [storageClass] to use
    storageClass: "nfs-client"
.....
.....
.....
    line 1040 : specify [storageClass] to use
    storageClass: "nfs-client"
.....
.....
.....
    line 2002 : specify [storageClass] to use
    storageClass: "nfs-client"
# create a namespace for Prometheus root@ctrl:~# kubectl create namespace monitoring namespace/monitoring created helm install prometheus --namespace monitoring -f prometheus.yaml bitnami/kube-prometheus
NAME: prometheus
LAST DEPLOYED: Fri Jul 28 01:53:01 2023
NAMESPACE: monitoring
STATUS: deployed
REVISION: 1
TEST SUITE: None
NOTES:
CHART NAME: kube-prometheus
CHART VERSION: 8.15.4
APP VERSION: 0.66.0

** Please be patient while the chart is being deployed **

Watch the Prometheus Operator Deployment status using the command:

    kubectl get deploy -w --namespace monitoring -l app.kubernetes.io/name=kube-prometheus-operator,app.kubernetes.io/instance=prometheus

Watch the Prometheus StatefulSet status using the command:

    kubectl get sts -w --namespace monitoring -l app.kubernetes.io/name=kube-prometheus-prometheus,app.kubernetes.io/instance=prometheus

Prometheus can be accessed via port "9090" on the following DNS name from within your cluster:

    prometheus-kube-prometheus-prometheus.monitoring.svc.cluster.local

To access Prometheus from outside the cluster execute the following commands:

    echo "Prometheus URL: http://127.0.0.1:9090/"
    kubectl port-forward --namespace monitoring svc/prometheus-kube-prometheus-prometheus 9090:9090

Watch the Alertmanager StatefulSet status using the command:

    kubectl get sts -w --namespace monitoring -l app.kubernetes.io/name=kube-prometheus-alertmanager,app.kubernetes.io/instance=prometheus

Alertmanager can be accessed via port "9093" on the following DNS name from within your cluster:

    prometheus-kube-prometheus-alertmanager.monitoring.svc.cluster.local

To access Alertmanager from outside the cluster execute the following commands:

    echo "Alertmanager URL: http://127.0.0.1:9093/"
    kubectl port-forward --namespace monitoring svc/prometheus-kube-prometheus-alertmanager 9093:9093
root@ctrl:~# kubectl get pods -n monitoring -o wide NAME READY STATUS RESTARTS AGE IP NODE NOMINATED NODE READINESS GATES alertmanager-prometheus-kube-prometheus-alertmanager-0 2/2 Running 0 64s 192.168.211.146 snode02.srv.world <none> <none> prometheus-kube-prometheus-blackbox-exporter-6bc45966c9-g2jpf 1/1 Running 0 90s 192.168.211.144 snode02.srv.world <none> <none> prometheus-kube-prometheus-operator-7557fb45f9-cpq5g 1/1 Running 0 90s 192.168.211.145 snode02.srv.world <none> <none> prometheus-kube-state-metrics-54888d8f94-kmxz4 1/1 Running 0 90s 192.168.186.70 snode01.srv.world <none> <none> prometheus-node-exporter-ppq52 1/1 Running 0 90s 10.0.0.71 snode01.srv.world <none> <none> prometheus-node-exporter-wr97b 1/1 Running 0 90s 10.0.0.72 snode02.srv.world <none> <none> prometheus-prometheus-kube-prometheus-prometheus-0 2/2 Running 0 64s 192.168.211.147 snode02.srv.world <none> <none> # if access from outside of cluster, set port-forwarding root@ctrl:~# kubectl port-forward -n monitoring service/prometheus-kube-prometheus-prometheus --address 0.0.0.0 9090:9090 |
| [3] | If you deploy Grafana, too, It's possible like follows. |
|
# output config and change some settings root@ctrl:~# helm inspect values bitnami/grafana > grafana.yaml
root@ctrl:~#
vi grafana.yaml # line 555 : change to your [storageClass] persistence: enabled: true ## If defined, storageClassName: <storageClass> ## If set to "-", storageClassName: "", which disables dynamic provisioning ## If undefined (the default) or set to null, no storageClassName spec is ## set, choosing the default provisioner. (gp2 on AWS, standard on ## GKE, AWS & OpenStack) ## storageClass: "nfs-client"root@ctrl:~# helm install grafana --namespace monitoring -f grafana.yaml bitnami/grafana
NAME: grafana
LAST DEPLOYED: Fri Jul 28 01:56:16 2023
NAMESPACE: monitoring
STATUS: deployed
REVISION: 1
TEST SUITE: None
NOTES:
CHART NAME: grafana
CHART VERSION: 9.0.5
APP VERSION: 10.0.3

** Please be patient while the chart is being deployed **

1. Get the application URL by running these commands:
    echo "Browse to http://127.0.0.1:8080"
    kubectl port-forward svc/grafana 8080:3000 &

2. Get the admin credentials:

    echo "User: admin"
    echo "Password: $(kubectl get secret grafana-admin --namespace monitoring -o jsonpath="{.data.GF_SECURITY_ADMIN_PASSWORD}" | base64 -d)"
root@ctrl:~# kubectl get pods -n monitoring NAME READY STATUS RESTARTS AGE grafana-5c9cc5b8d9-zr4qf 1/1 Running 0 56s ..... ..... # if access from outside of cluster, set port-forwarding root@ctrl:~# kubectl port-forward -n monitoring service/grafana --address 0.0.0.0 3000:3000 |
| [4] |
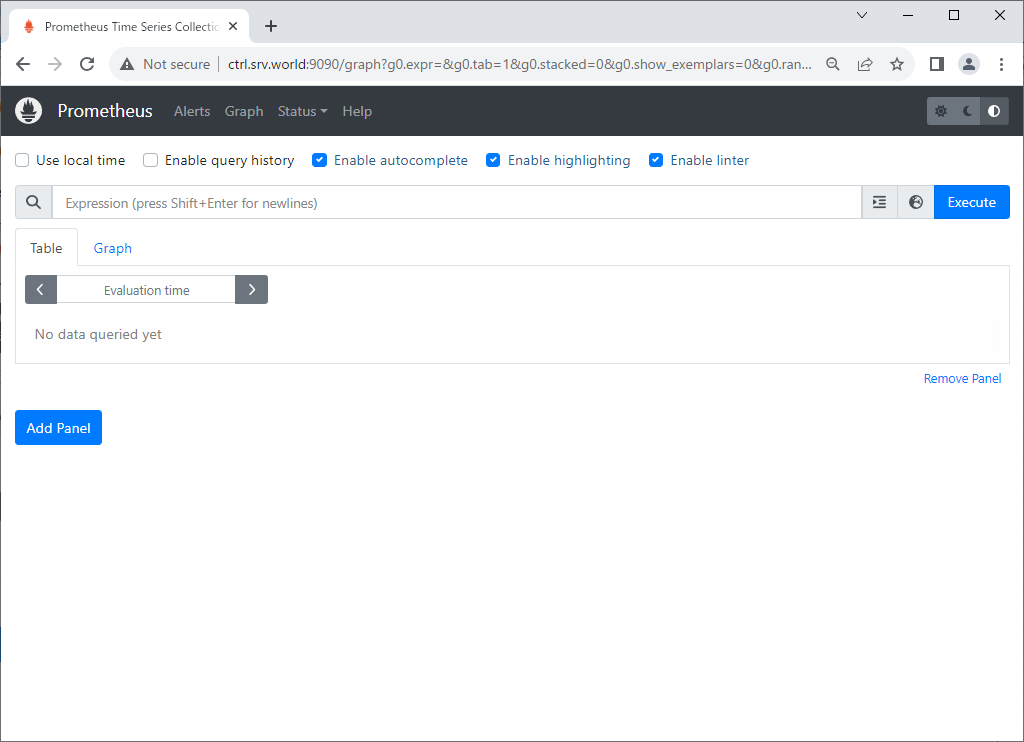
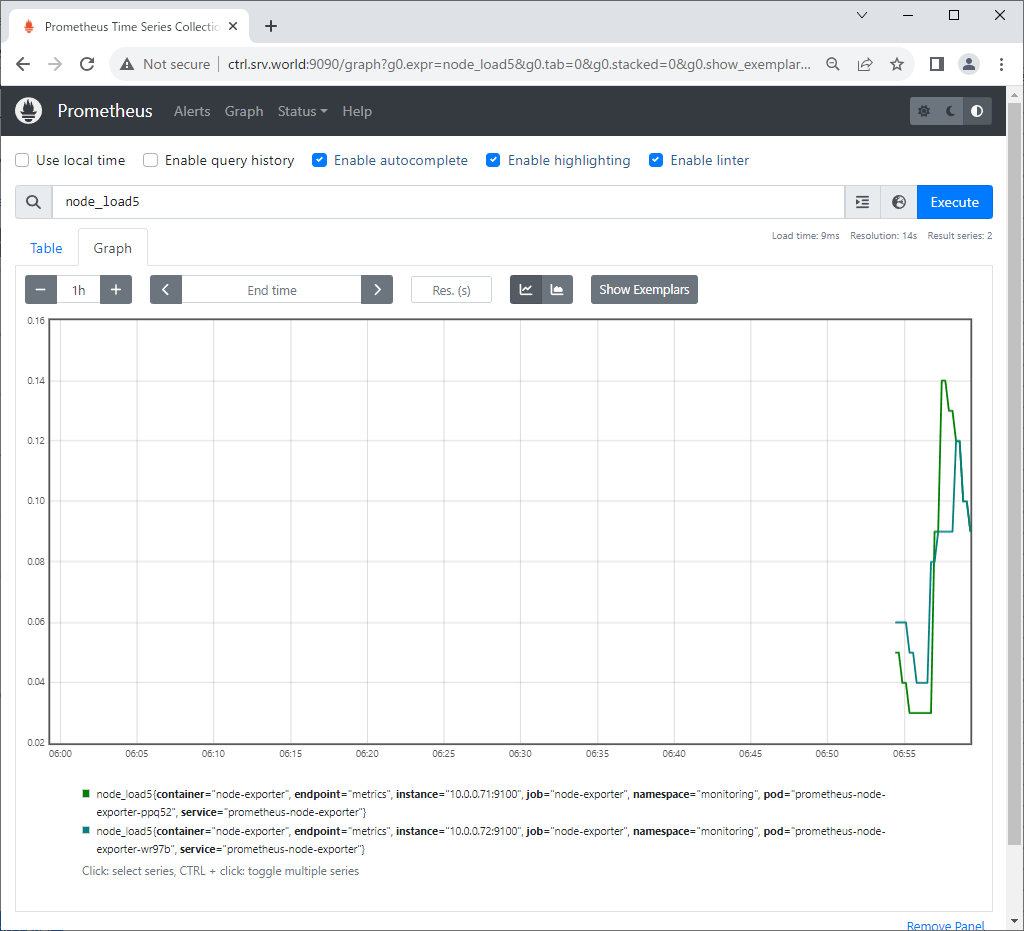
If you access to Prometheus UI from a Host in cluster, access to the URL below with an Web browser.
⇒ http://prometheus-kube-prometheus-prometheus.monitoring.svc.cluster.local
If you set port-forwarding, access to the URL below on a client computer in your local network.
⇒ http://(Control Plane Node Hostname or IP address):(setting port)/
That's OK if following Prometheus UI is displayed.
|
|
|
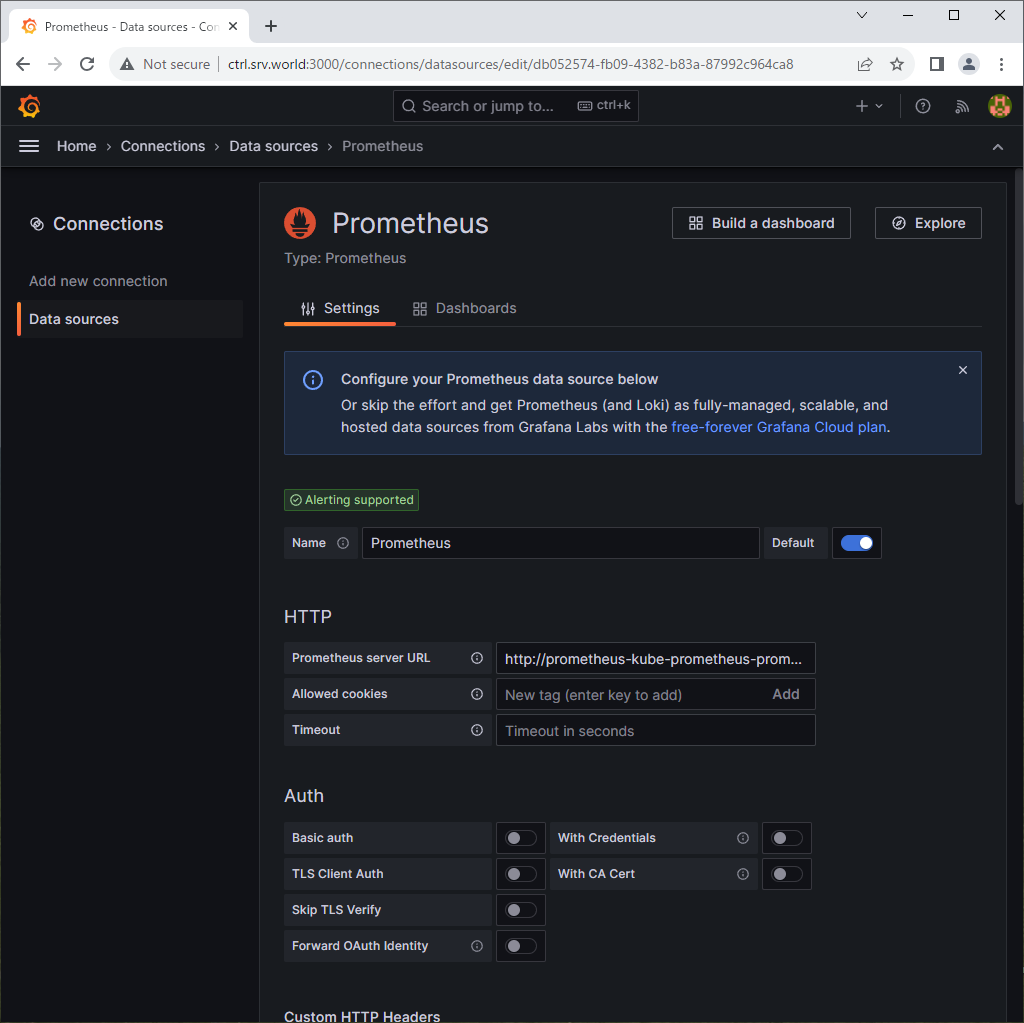
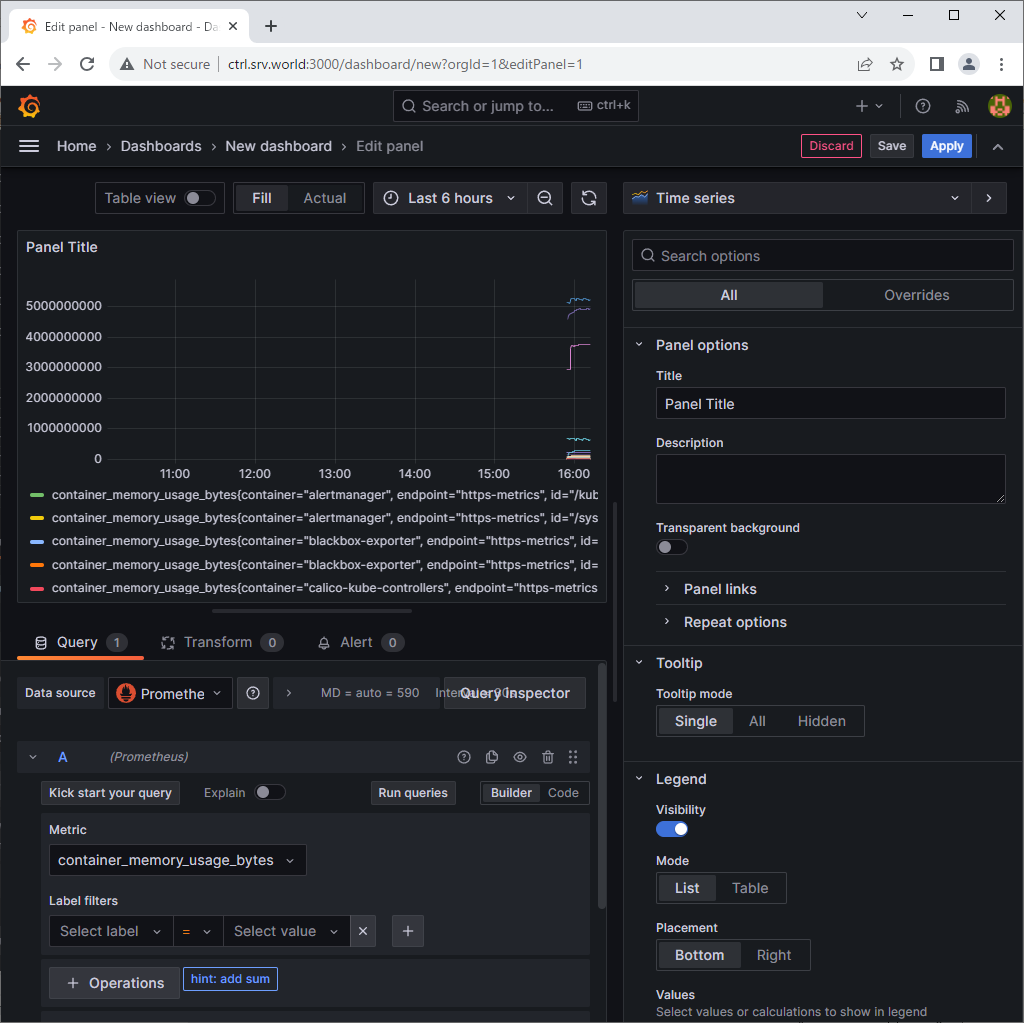
| [5] |
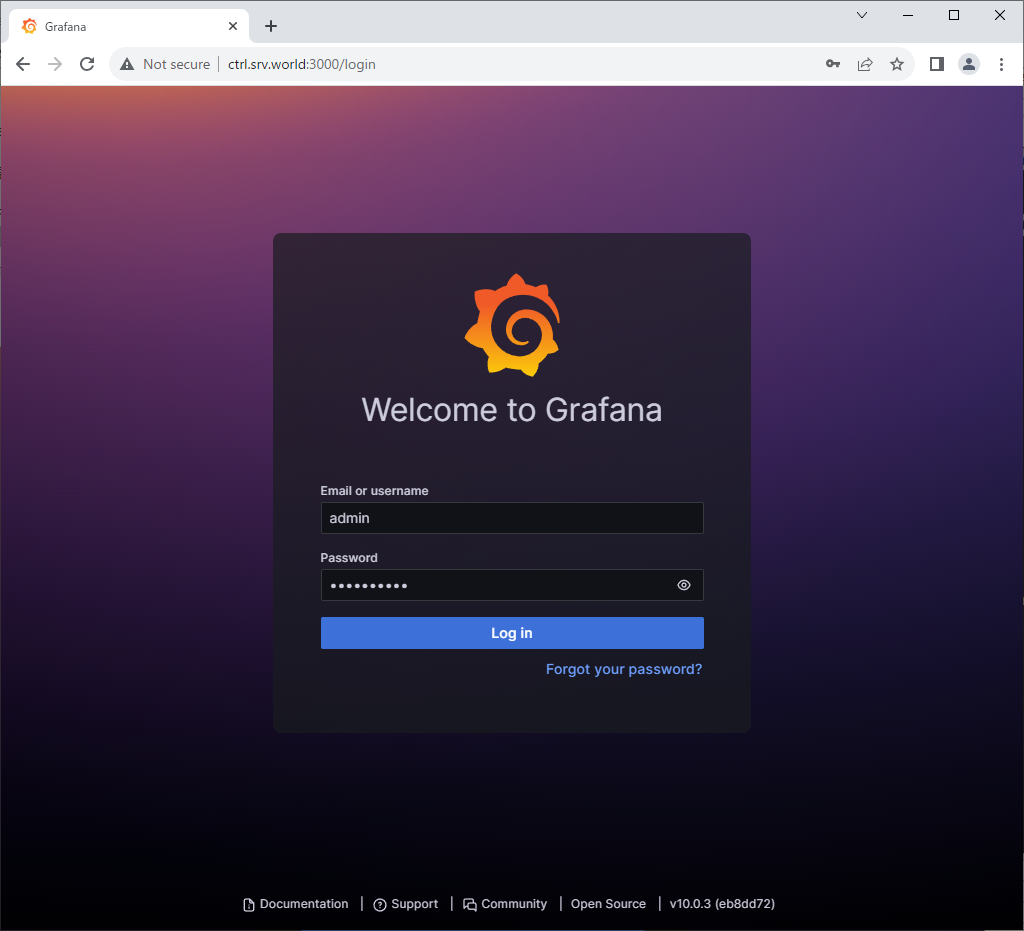
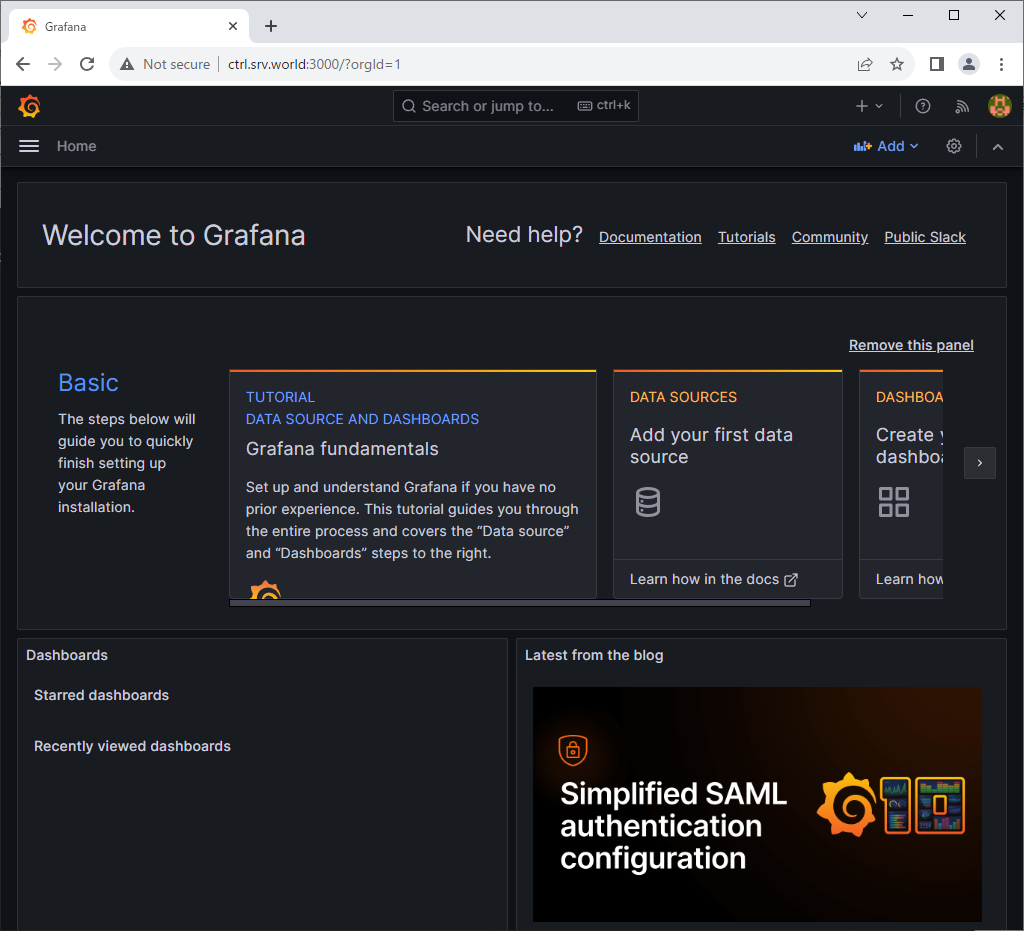
If you access to Grafana from a Host in cluster, access to the URL below with an Web browser.
⇒ http://grafana.monitoring.svc.cluster.local
If you set port-forwarding, access to the URL below on a client computer in your local network.
⇒ http://(Control Plane Node Hostname or IP address):(setting port)/
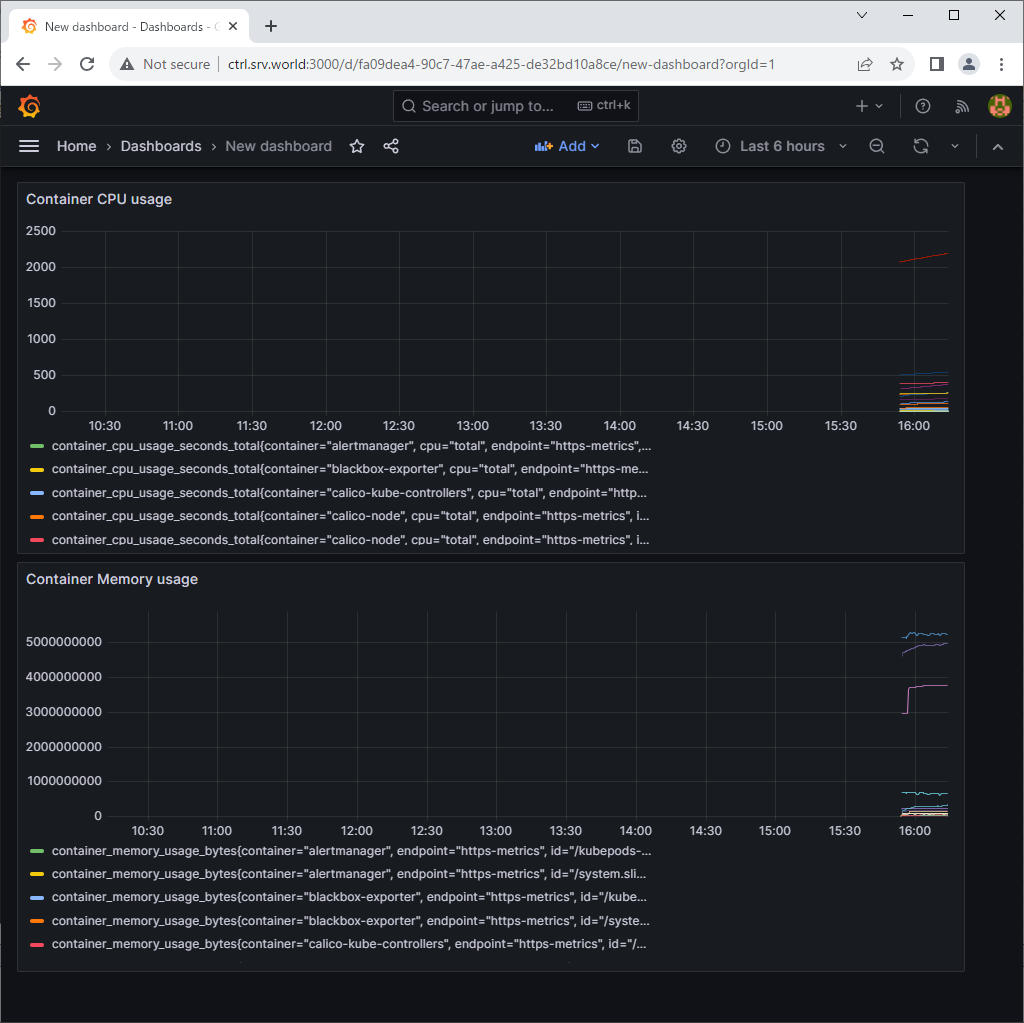
That's OK if following Grafana UI is displayed.
For [admin] password, it's possible to confirm with the command below.⇒ echo "Password: $(kubectl get secret grafana-admin --namespace monitoring -o jsonpath="{.data.GF_SECURITY_ADMIN_PASSWORD}" | base64 -d)" |
|
|
|
|
|
Matched Content