Grafana : Install2021/09/17 |
|
Install Web Dashboard tool, Grafana.
Grafana is the visualize tool, so it needs data source from Database System like
Graphite, Prometheus, Elasticsearch, InfluxDB, OpenTSDB, AWS Cloudwatch, MySQL, PostgreSQL and so on. |
|
| [1] | Install Grafana from Snappy. |
|
root@dlp:~#
apt -y install snapd
root@dlp:~#
root@dlp:~# snap install grafana grafana 6.7.4 from Alvaro Uría (aluria) installed snap info grafana name: grafana summary: feature rich metrics dashboard and graph editor publisher: Alvaro Uría (aluria) store-url: https://snapcraft.io/grafana contact: https://launchpad.net/grafana-snap license: unset description: | Grafana is a feature rich metrics dashboard and graph editor for Cloudwatch, Elasticsearch, Graphite, InfluxDB, OpenTSB, Prometheus, and Hosted Metrics. commands: - grafana.grafana-cli services: grafana: simple, enabled, active snap-id: ehNKbg99zAxHVPCJX5LobcPRwM1xxq4P tracking: latest/stable refresh-date: today at 22:56 CDT ..... ..... |
| [2] | Access to [http://(Grafana server's hostname or IP address):3000/] from any Clients with web browser, then, Grafana login form is shown like follows. It's possible to login with [admin] user and with the default password [admin]. |

|
| [3] | When initial login, it needs to change admin password. Set any one and Click [Save] button. |

|
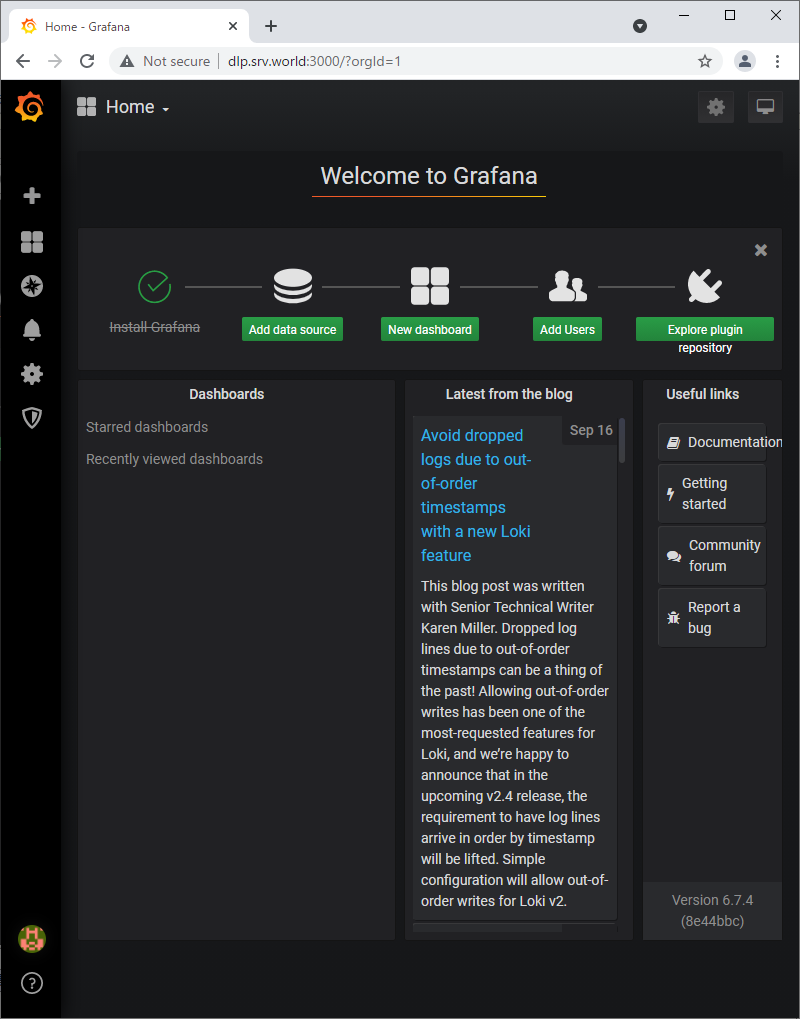
| [4] | After login normally, Grafana Home is shown. |
|
Matched Content