Ceph Nautilus : Enable Dashboard2021/08/26 |
|
Enable Ceph Dashboard to manage Ceph Cluster on Web Console.
This example is based on the environment like follows.
                                         |
        +--------------------+           |           +----------------------+
        |   [dlp.srv.world]  |10.0.0.30  |  10.0.0.31|    [www.srv.world]   |
        |     Ceph Client    +-----------+-----------+        RADOSGW       |
        |                    |           |           |                      |
        +--------------------+           |           +----------------------+
            +----------------------------+----------------------------+
            |                            |                            |
            |10.0.0.51                   |10.0.0.52                   |10.0.0.53
+-----------+-----------+    +-----------+-----------+    +-----------+-----------+
|   [node01.srv.world]  |    |   [node02.srv.world]  |    |   [node03.srv.world]  |
|     Object Storage    +----+     Object Storage    +----+     Object Storage    |
|     Monitor Daemon    |    |                       |    |                       |
|     Manager Daemon    |    |                       |    |                       |
+-----------------------+    +-----------------------+    +-----------------------+
|
| [1] | Enable Dashboard module on [Manager Daemon] Node. Furthermore, Dashboard requires SSL/TLS. Create a self-signed certificate on this example. |
|
root@node01:~#
root@node01:~# apt -y install ceph-mgr-dashboard ceph mgr module enable dashboard root@node01:~# ceph mgr module ls | grep -A 5 enabled_modules
    "enabled_modules": [
        "dashboard",
        "iostat",
        "pg_autoscaler",
        "restful"
    ],
# create self-signed certificate root@node01:~# ceph dashboard create-self-signed-cert Self-signed certificate created # create a user for Dashboard # [ceph dashboard ac-user-create (username) -i (password file) administrator] root@node01:~# echo "password" > pass.txt root@node01:~# ceph dashboard ac-user-create serverworld -i pass.txt administrator
{"username": "serverworld", "password": "$2b$12$9POoiJOd9E33/b9tj7cI5.ZHgA4xd.EIMdEOsGmpZAY.bvoNn4882", "roles": ["administrator"], "name": null, "email": null, "lastUpdate": 1629940242}
# confirm Dashboard URL root@node01:~# ceph mgr services
{
    "dashboard": "https://node01.srv.world:8443/"
}
|
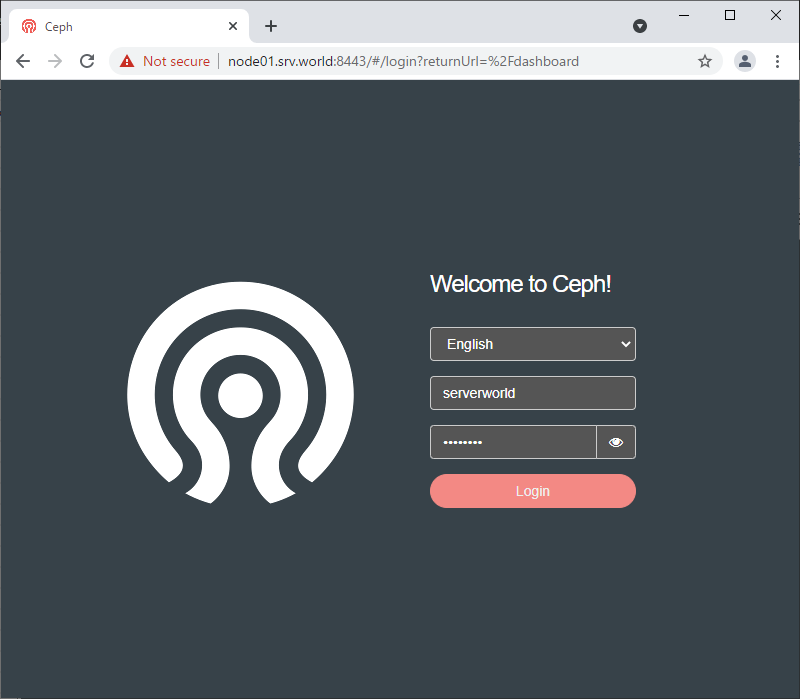
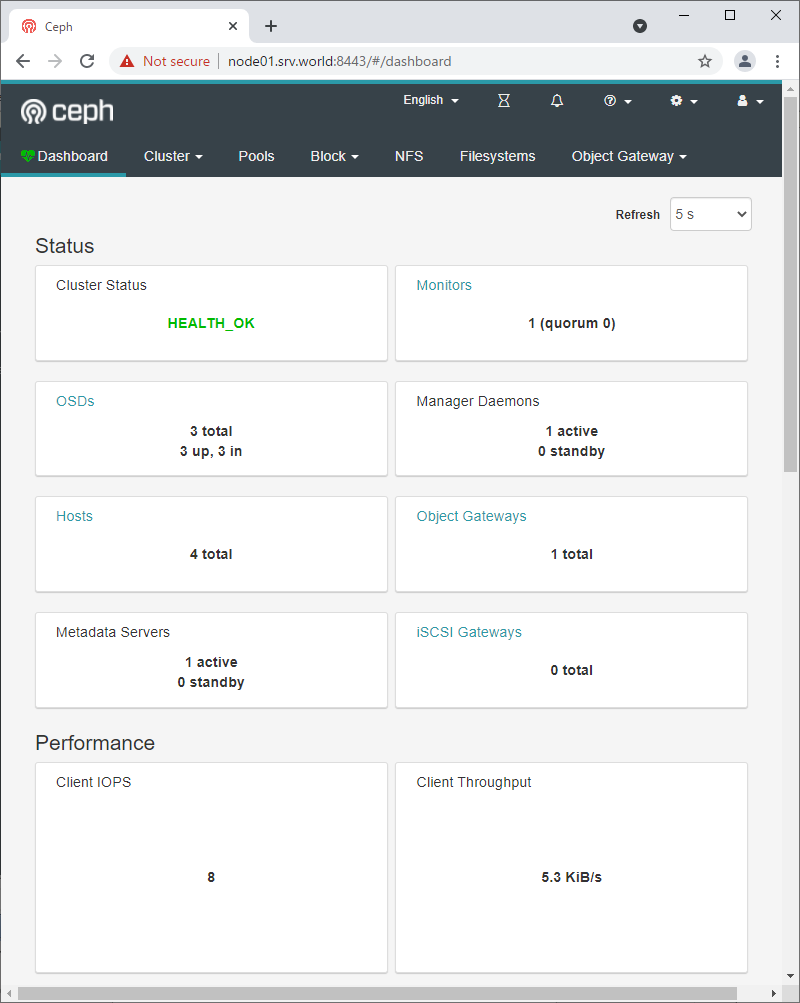
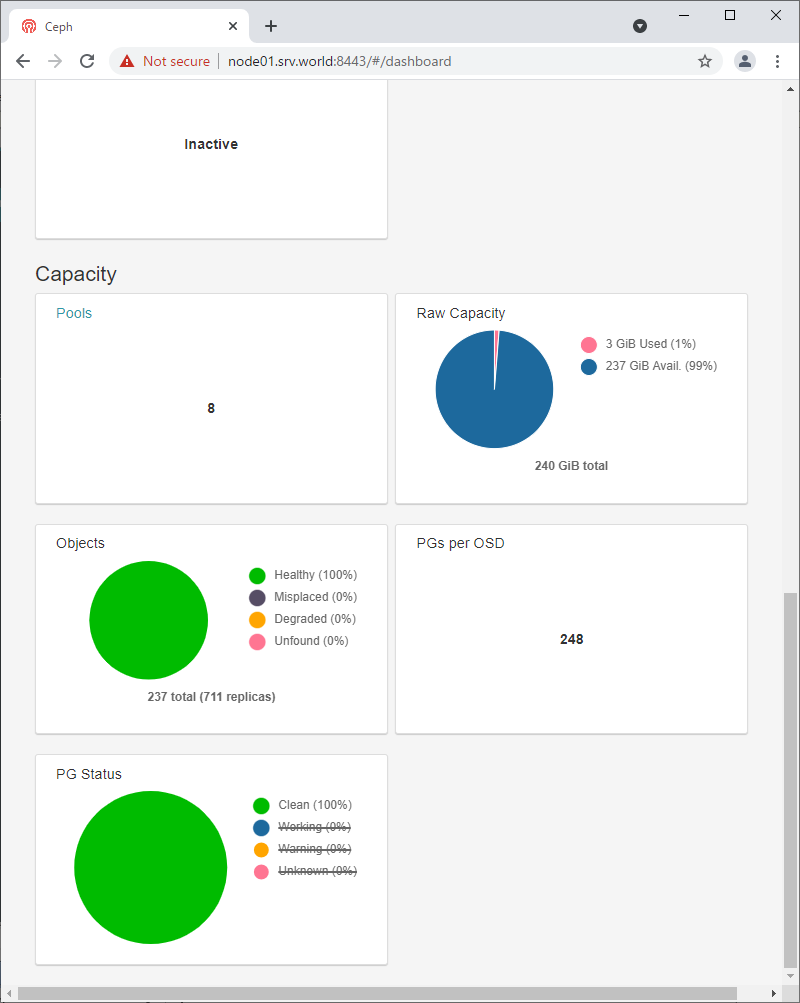
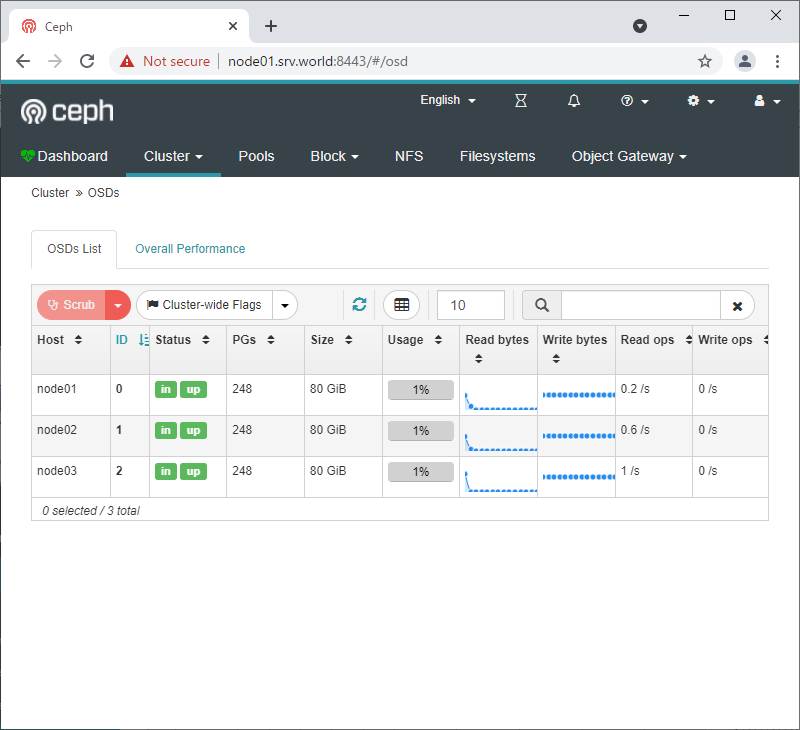
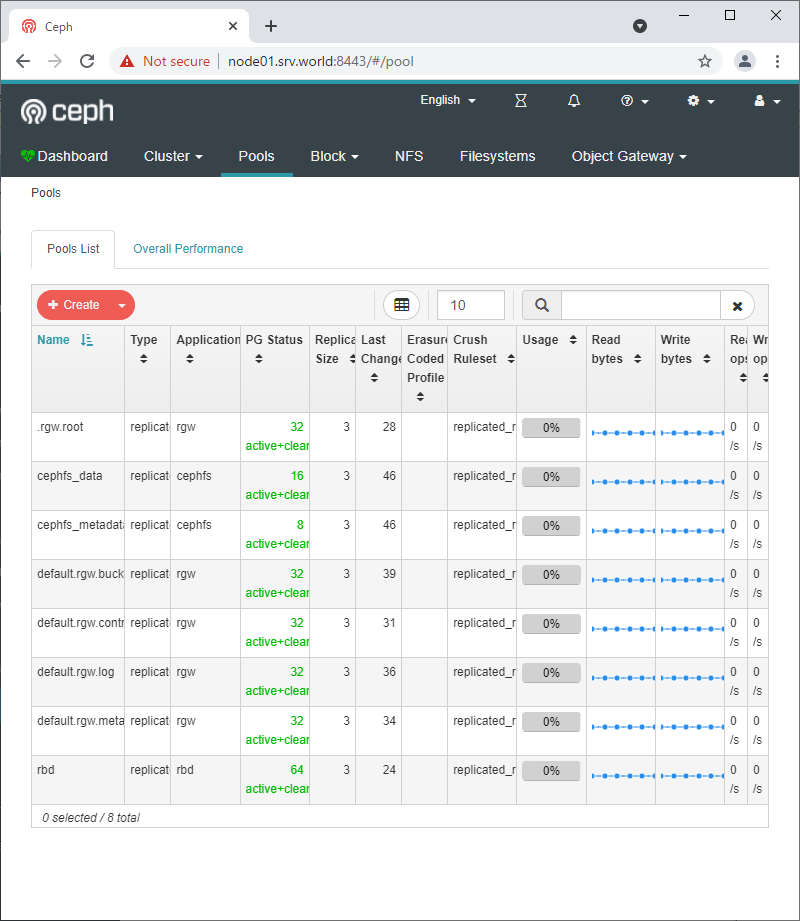
| [2] | Access to the Dashboard URL from a Client Computer with Web Browser, then Ceph Dashboard Login form is shown. Login as a user you just added in [1] section. After login, it's possible to see various status of Ceph Cluster. |
|
|
|
|
|
Matched Content