Kubernetes : Deploy Prometheus2023/10/23 |
|
Deploy Prometheus to monitor metrics in Kubernetes Cluster. This example is based on the environment like follows.
+----------------------+   +----------------------+
|   [ mgr.srv.world ]  |   |   [ dlp.srv.world ]  |
|     Manager Node     |   |     Control Plane    |
+-----------+----------+   +-----------+----------+
        eth0|10.0.0.25             eth0|10.0.0.30
            |                          |
------------+--------------------------+-----------
            |                          |
        eth0|10.0.0.51             eth0|10.0.0.52
+-----------+----------+   +-----------+----------+
| [ node01.srv.world ] |   | [ node02.srv.world ] |
|     Worker Node#1    |   |     Worker Node#2    |
+----------------------+   +----------------------+
|
| [1] |
Persistent storage is needed for Prometheus.
On this example, configure [nfs.srv.world:/home/nfsshare] directory on NFS server as external storage, and also configure dynamic volume provisioning with NFS plugin like the example [1], [2], [3] of here. |
| [2] | Install Prometheus chart with Helm. |
|
# output config and change some settings [root@mgr ~]# helm inspect values bitnami/kube-prometheus > prometheus.yaml
[root@mgr ~]#
vi prometheus.yaml
.....
.....
    line 21 : specify [storageClass] to use
    storageClass: "nfs-client"
.....
.....
.....
    line 1058 : specify [storageClass] to use
    storageClass: "nfs-client"
.....
.....
.....
    line 2036 : specify [storageClass] to use
    storageClass: "nfs-client"
# create a namespace for Prometheus [root@mgr ~]# kubectl create namespace monitoring namespace/monitoring created helm install prometheus --namespace monitoring -f prometheus.yaml bitnami/kube-prometheus
NAME: prometheus
LAST DEPLOYED: Mon Oct 23 10:33:45 2023
NAMESPACE: monitoring
STATUS: deployed
REVISION: 1
TEST SUITE: None
NOTES:
CHART NAME: kube-prometheus
CHART VERSION: 8.21.6
APP VERSION: 0.68.0

** Please be patient while the chart is being deployed **

Watch the Prometheus Operator Deployment status using the command:

    kubectl get deploy -w --namespace monitoring -l app.kubernetes.io/name=kube-prometheus-operator,app.kubernetes.io/instance=prometheus

Watch the Prometheus StatefulSet status using the command:

    kubectl get sts -w --namespace monitoring -l app.kubernetes.io/name=kube-prometheus-prometheus,app.kubernetes.io/instance=prometheus

Prometheus can be accessed via port "9090" on the following DNS name from within your cluster:

    prometheus-kube-prometheus-prometheus.monitoring.svc.cluster.local

To access Prometheus from outside the cluster execute the following commands:

    echo "Prometheus URL: http://127.0.0.1:9090/"
    kubectl port-forward --namespace monitoring svc/prometheus-kube-prometheus-prometheus 9090:9090

Watch the Alertmanager StatefulSet status using the command:

    kubectl get sts -w --namespace monitoring -l app.kubernetes.io/name=kube-prometheus-alertmanager,app.kubernetes.io/instance=prometheus

Alertmanager can be accessed via port "9093" on the following DNS name from within your cluster:

    prometheus-kube-prometheus-alertmanager.monitoring.svc.cluster.local

To access Alertmanager from outside the cluster execute the following commands:

    echo "Alertmanager URL: http://127.0.0.1:9093/"
    kubectl port-forward --namespace monitoring svc/prometheus-kube-prometheus-alertmanager 9093:9093
[root@mgr ~]# kubectl get pods -n monitoring NAME READY STATUS RESTARTS AGE alertmanager-prometheus-kube-prometheus-alertmanager-0 2/2 Running 0 2m8s prometheus-kube-prometheus-blackbox-exporter-586779659-72cst 1/1 Running 0 2m24s prometheus-kube-prometheus-operator-74675d8559-dlzk8 1/1 Running 0 2m24s prometheus-kube-state-metrics-7769f89694-ggdbz 1/1 Running 0 2m24s prometheus-node-exporter-9vgbw 1/1 Running 0 2m24s prometheus-node-exporter-gdkjc 1/1 Running 0 2m24s prometheus-prometheus-kube-prometheus-prometheus-0 2/2 Running 0 2m8s # if access from outside of cluster, set port-forwarding [root@mgr ~]# kubectl port-forward -n monitoring service/prometheus-kube-prometheus-prometheus --address 0.0.0.0 9090:9090 & |
| [3] | If you deploy Grafana, too, It's possible like follows. |
|
# output config and change some settings [root@mgr ~]# helm inspect values bitnami/grafana > grafana.yaml
[root@mgr ~]#
vi grafana.yaml # line 558 : change to your [storageClass] persistence: enabled: true ## If defined, storageClassName: <storageClass> ## If set to "-", storageClassName: "", which disables dynamic provisioning ## If undefined (the default) or set to null, no storageClassName spec is ## set, choosing the default provisioner. (gp2 on AWS, standard on ## GKE, AWS & OpenStack) ## storageClass: "nfs-client"[root@mgr ~]# helm install grafana --namespace monitoring -f grafana.yaml bitnami/grafana
NAME: grafana
LAST DEPLOYED: Mon Oct 23 10:38:58 2023
NAMESPACE: monitoring
STATUS: deployed
REVISION: 1
TEST SUITE: None
NOTES:
CHART NAME: grafana
CHART VERSION: 9.3.2
APP VERSION: 10.1.5

** Please be patient while the chart is being deployed **

1. Get the application URL by running these commands:
    echo "Browse to http://127.0.0.1:8080"
    kubectl port-forward svc/grafana 8080:3000 &

2. Get the admin credentials:

    echo "User: admin"
    echo "Password: $(kubectl get secret grafana-admin --namespace monitoring -o jsonpath="{.data.GF_SECURITY_ADMIN_PASSWORD}" | base64 -d)"
[root@mgr ~]# kubectl get pods -n monitoring NAME READY STATUS RESTARTS AGE alertmanager-prometheus-kube-prometheus-alertmanager-0 2/2 Running 0 5m50s grafana-6d54c5d759-gk9dn 1/1 Running 0 54s prometheus-kube-prometheus-blackbox-exporter-586779659-72cst 1/1 Running 0 6m6s prometheus-kube-prometheus-operator-74675d8559-dlzk8 1/1 Running 0 6m6s prometheus-kube-state-metrics-7769f89694-ggdbz 1/1 Running 0 6m6s prometheus-node-exporter-9vgbw 1/1 Running 0 6m6s prometheus-node-exporter-gdkjc 1/1 Running 0 6m6s prometheus-prometheus-kube-prometheus-prometheus-0 2/2 Running 0 5m50s # if access from outside of cluster, set port-forwarding [root@mgr ~]# kubectl port-forward -n monitoring service/grafana --address 0.0.0.0 3000:3000 & |
| [4] |
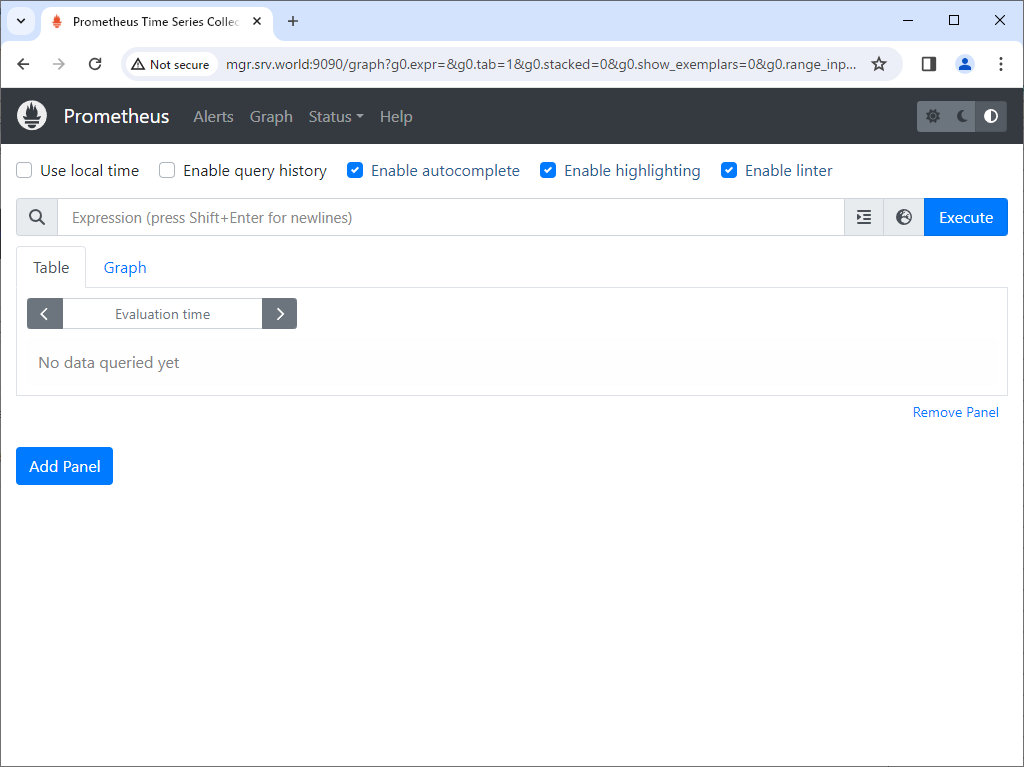
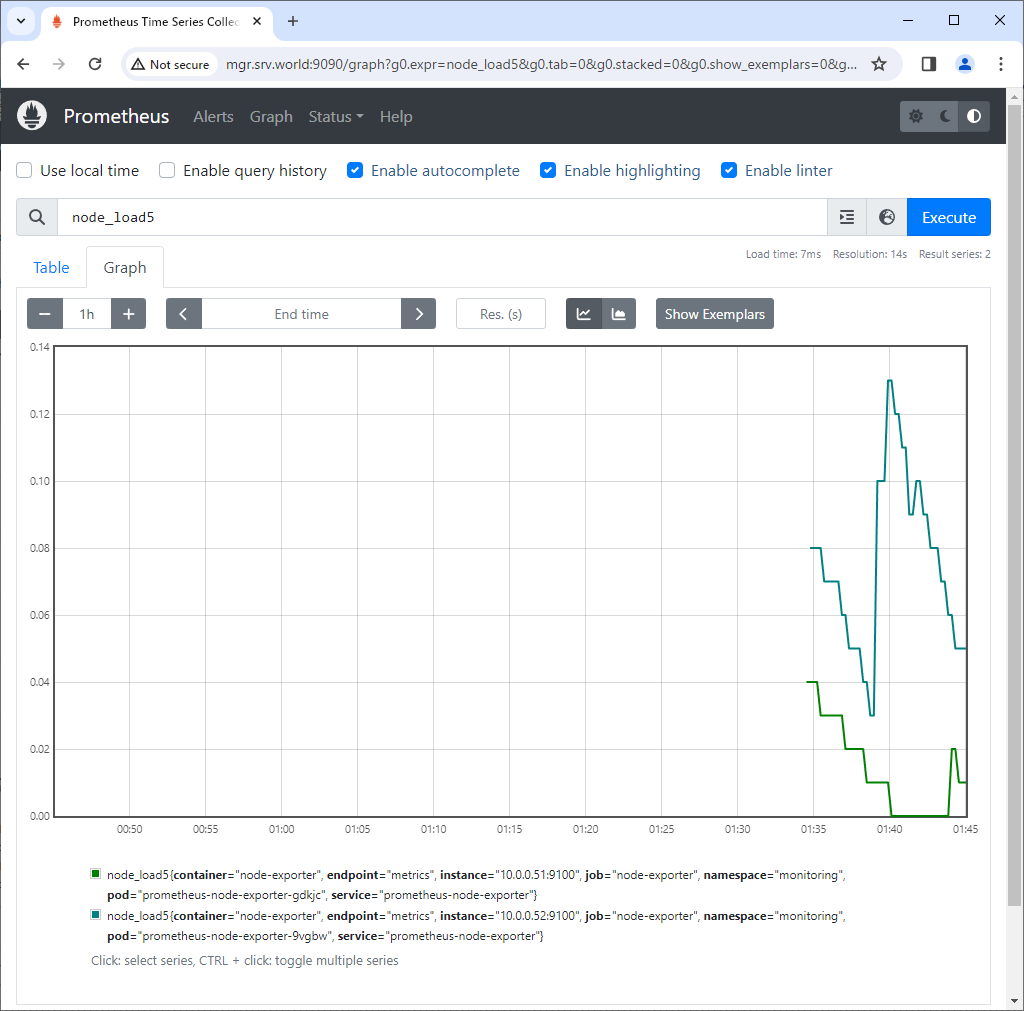
If you access to Prometheus UI from a Host in cluster, access to the URL below with an Web browser.
⇒ http://prometheus-kube-prometheus-prometheus.monitoring.svc.cluster.local
If you set port-forwarding, access to the URL below on a client computer in your local network.
⇒ http://(Manager Node Hostname or IP address):(setting port)/
That's OK if following Prometheus UI is displayed.
|
|
|
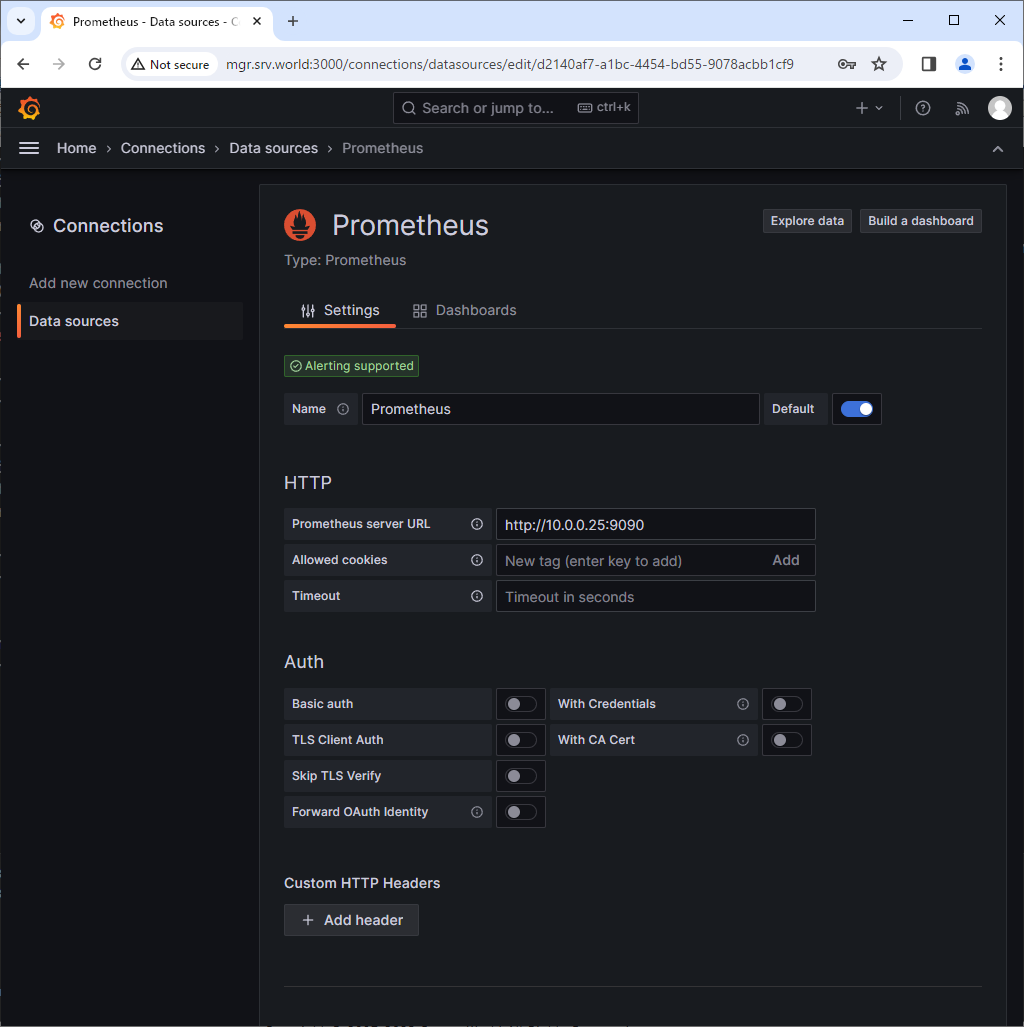
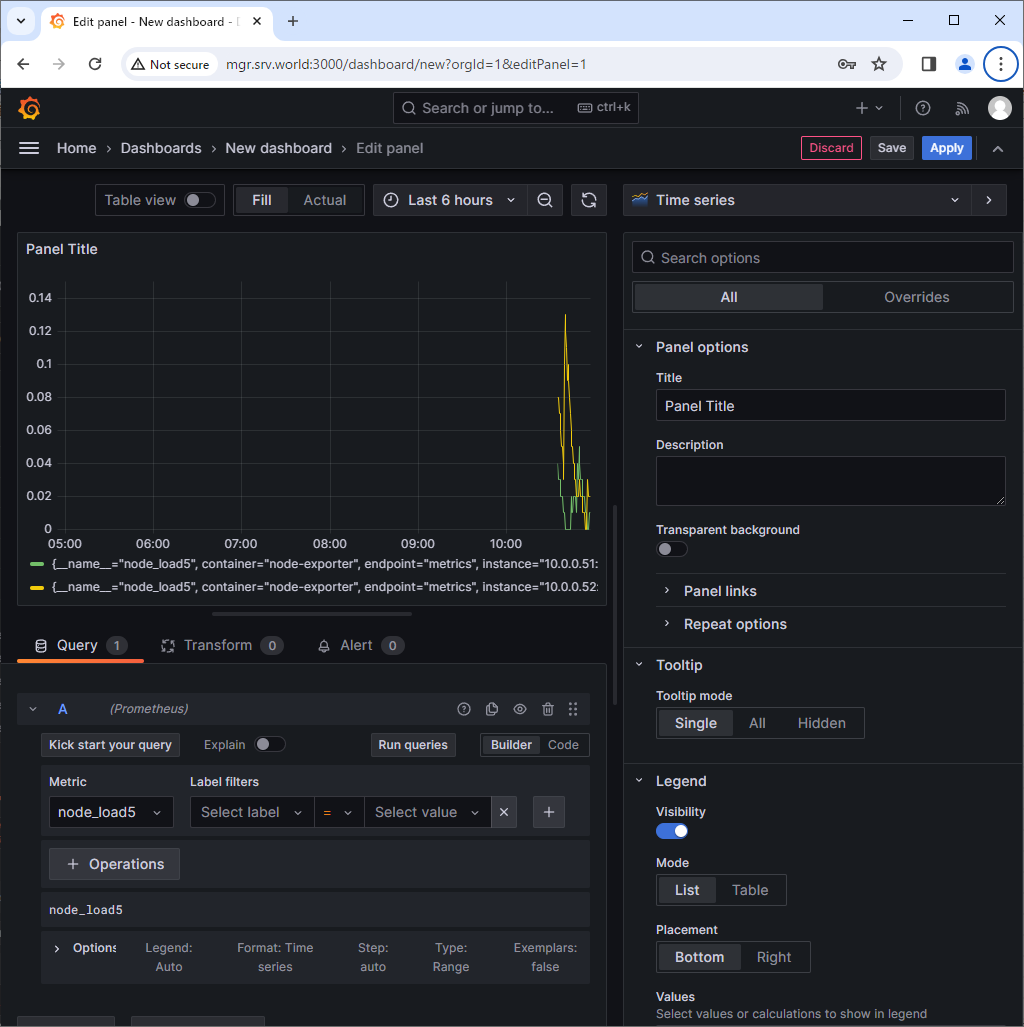
| [5] |
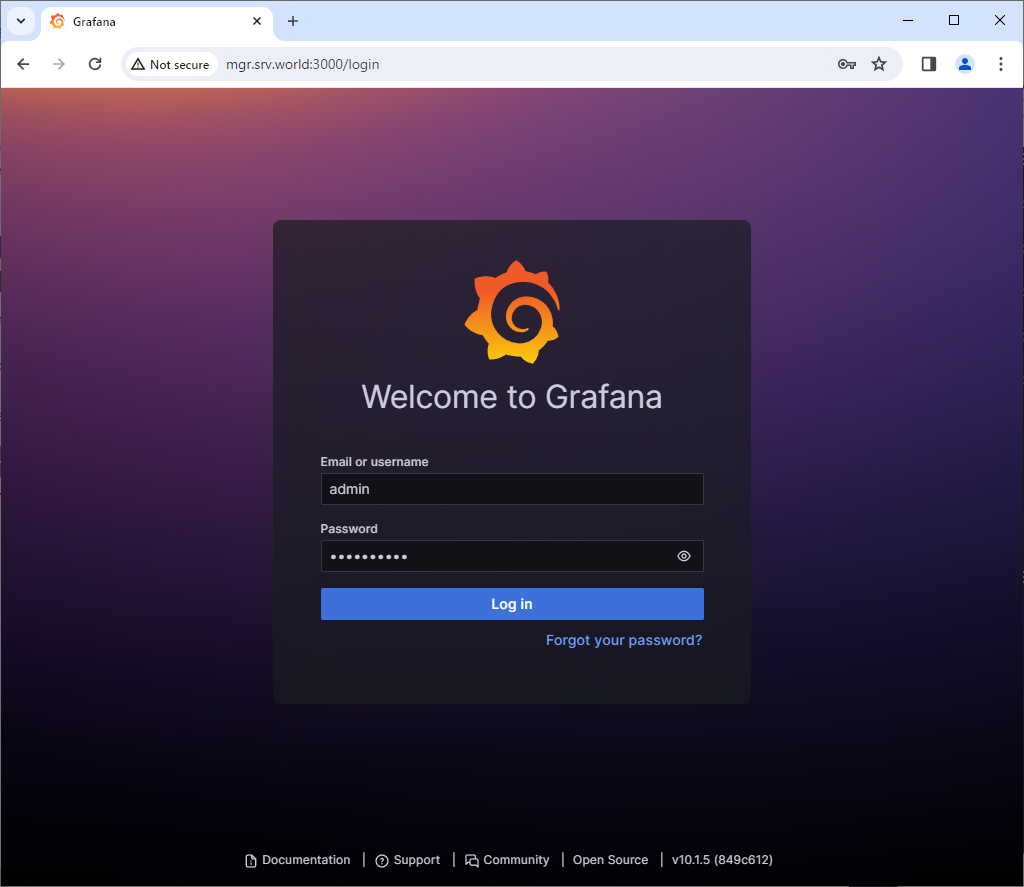
If you access to Grafana from a Host in cluster, access to the URL below with an Web browser.
⇒ http://grafana.monitoring.svc.cluster.local
If you set port-forwarding, access to the URL below on a client computer in your local network.
⇒ http://(Manager Node Hostname or IP address):(setting port)/
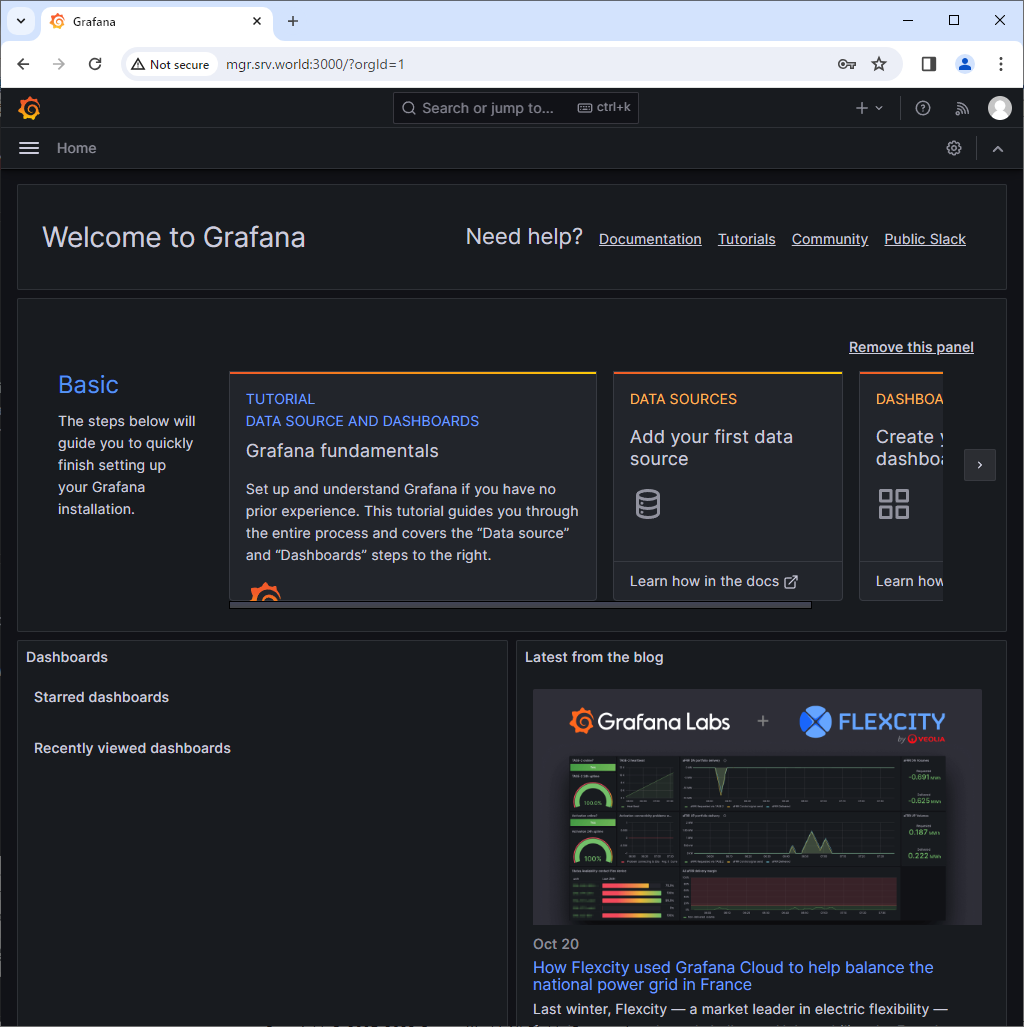
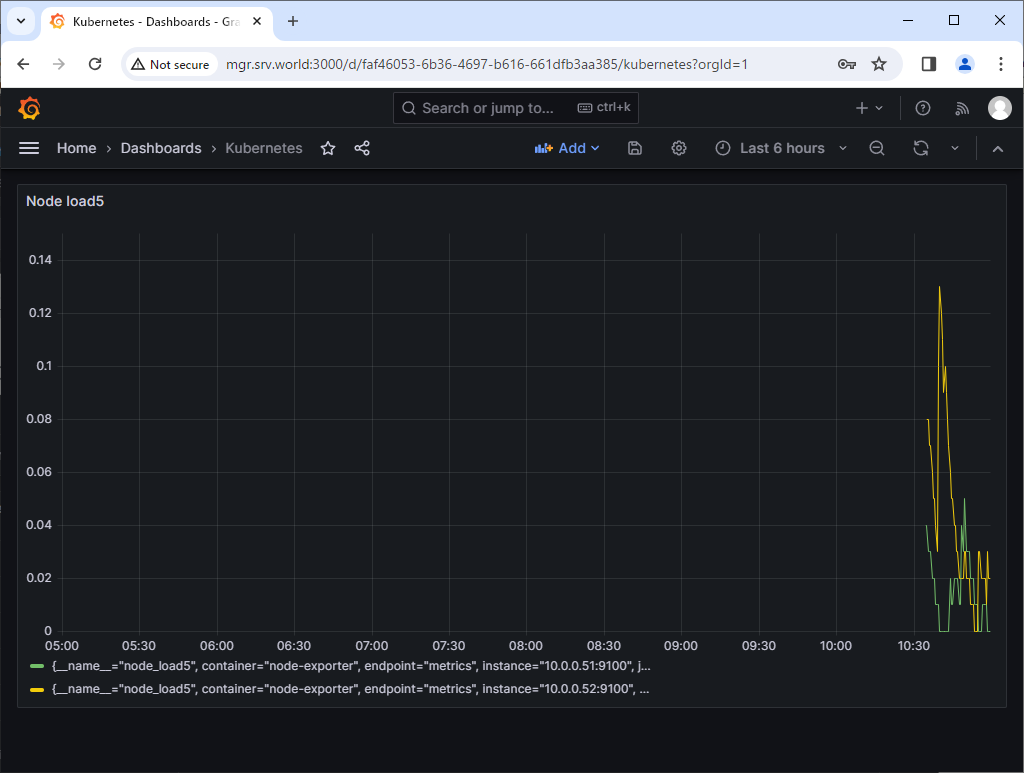
That's OK if following Grafana UI is displayed.
For [admin] password, it's possible to confirm with the command below.⇒ echo "Password: $(kubectl get secret grafana-admin --namespace monitoring -o jsonpath="{.data.GF_SECURITY_ADMIN_PASSWORD}" | base64 -d)" |
|
|
|
|
|
Matched Content