Grafana : Install2022/06/30 |
|
Install Web Dashboard tool, Grafana.
Grafana is the visualize tool, so it needs data source from Database System like
Graphite, Prometheus, Elasticsearch, InfluxDB, OpenTSDB, AWS Cloudwatch, MySQL, PostgreSQL and so on. |
|
| [1] | Install Grafana. |
|
[root@dlp ~]#
dnf -y install grafana
[root@dlp ~]#
vi /etc/grafana/grafana.ini # line 35 : specify protocol ⇒ possible to change to [https], [h2], [socket] protocol = http # line 38 : IP address Grafana listens (listen all with [0.0.0.0]) http_addr = 0.0.0.0
# line 41 : specify port ⇒ possible to change to other port http_port = 3000 # line 44 : specify domain name ⇒ possible to change to your domain name domain = localhost # line 67 : specify your certificate if you set [https] or [h2] for protocol cert_file = /etc/letsencrypt/live/dlp.srv.world/fullchain.pem cert_key = /etc/letsencrypt/live/dlp.srv.world/privkey.pem
systemctl enable --now grafana-server
|
| [2] | If Firewalld is running, allow service ports. |
|
[root@dlp ~]# firewall-cmd --add-port=3000/tcp success [root@dlp ~]# firewall-cmd --runtime-to-permanent success |
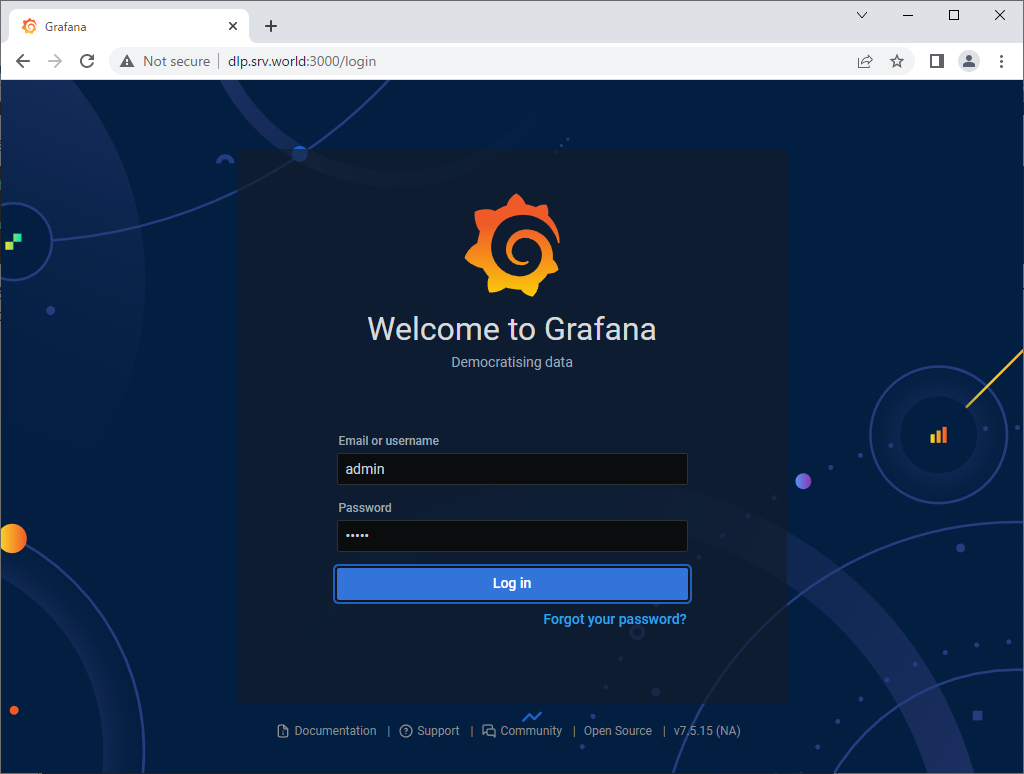
| [3] | Access to [http://(Grafana server's hostname or IP address):3000/] from any Clients with web browser, then, Grafana login form is shown like follows. It's possible to login with [admin] user and with the default password [admin]. |
|
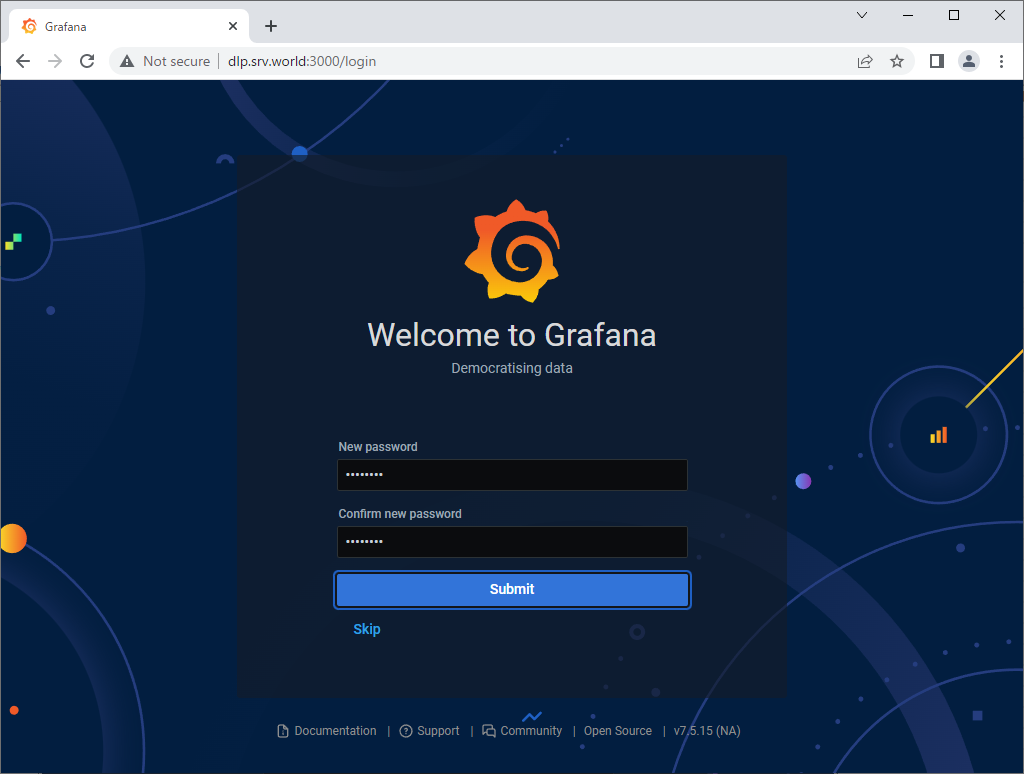
| [4] | When initial login, it needs to change admin password. Set any one and Click [Submit] button. |
|
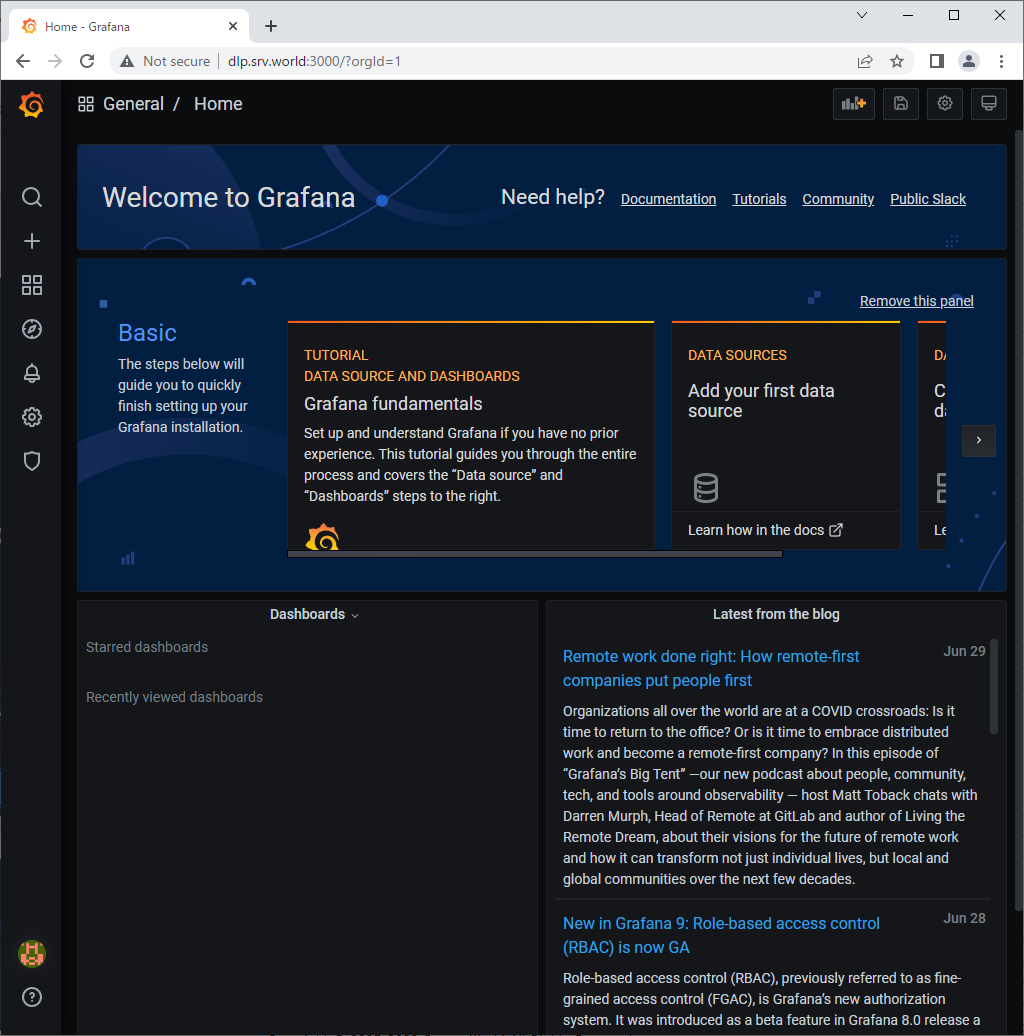
| [5] | After login normally, Grafana Home is shown. |
|
Matched Content