Elastic Stack 7 : X-Pack.Monitoring2021/06/22 |
|
Configure X-Pack.Monitoring which monitors Elasticsearch or Kibana and so on.
Most plugins included in X-Pack are not for free, so you mush buy licenses to use.
However, you can try to use for 30 days with trial license.
Refer to the official site about subscription below.
⇒ https://www.elastic.co/subscriptions |
|
| [1] |
From Elastic Stack 7, X-Pack is installed by default, so it's not need to install it manualy.
|
| [2] |
Configure X-Pack.Monitoring on all Nodes that Elasticsearch is running.
About features of X-Pack, refer to the official site below.On this example, Disable most features like Security first. If you enable them, refer to the next tutorial. ⇒ https://www.elastic.co/guide/en/elasticsearch/reference/current/settings-xpack.html |
|
[root@dlp ~]#
vi /etc/elasticsearch/elasticsearch.yml # add to the end # set license type (follow is the trial license) xpack.license.self_generated.type: trial # set Monitoring (enabled) xpack.monitoring.collection.enabled: true # set Security (disabled) xpack.security.enabled: false xpack.security.transport.ssl.enabled: false
[root@dlp ~]#
systemctl restart elasticsearch kibana logstash # access to show the index list ,then you can find new data from Monitoring (.monitoring***) [root@dlp ~]# curl localhost:9200/_cat/indices?v health status index uuid pri rep docs.count docs.deleted store.size pri.store.size green open .apm-agent-configuration y3hQme2SQpGMtb64NLsNdA 1 0 0 0 208b 208b green open .monitoring-kibana-7-2021.06.22 kwO6mH_KS3CflADDho3_Jw 1 0 8 0 48.5kb 48.5kb yellow open winlogbeat-7.13.2-2021.06.22-000001 gTKUKWkrQdWP_TzEnrlowA 1 1 1932 0 1.6mb 1.6mb yellow open heartbeat-7.13.2-2021.06.22-000001 LHK787g7S92UFiUXDDrwpQ 1 1 669 0 578kb 578kb green open .tasks 2gvaahTYQKCS8QPLGl1irg 1 0 2 0 7.7kb 7.7kb green open .monitoring-es-7-2021.06.22 6Dt-UADhSEO-1xMwIBqnnA 1 0 101 24 268.6kb 268.6kb green open .kibana_7.13.2_001 zA_r0rrjT7OMUMVSGmRVfg 1 0 5332 0 7.1mb 7.1mb green open .apm-custom-link d1-9Pkn-RXOu_qhMOanvVA 1 0 0 0 208b 208b yellow open filebeat-7.13.2-2021.06.22-000001 c18zEwqAQVeNecW7d6EAQg 1 1 11859 0 1.8mb 1.8mb green open .kibana-event-log-7.13.2-000001 Y-rCmM6yTBKa9W5H1LeJ1g 1 0 1 0 5.6kb 5.6kb yellow open auditbeat-7.13.2-2021.06.22-000001 -kMW1wnKQ9-b8WjnJmvScA 1 1 5552 0 5.5mb 5.5mb green open .async-search WRLoMwCITRKD3C_BrFJ9bw 1 0 68 99 127.8kb 127.8kb green open .kibana_task_manager_7.13.2_001 x6V232xKQLinqRedJRAbgw 1 0 10 32 265kb 265kb yellow open packetbeat-7.13.2-2021.06.22-000001 nYN59YPRQwGmDrMRXijZxA 1 1 89894 0 28mb 28mb yellow open test_index Vh0HutpLRciaMWX3pFo7Zg 1 1 1 0 5.5kb 5.5kb yellow open sshd_fail-2021.06 HiOI2ac-RzK2BiwQ_gb-VQ 1 1 43 0 68.7kb 68.7kb yellow open metricbeat-7.13.2-2021.06.22-000001 aVbbCHScQBujmT8JMRdRBw 1 1 24598 0 19.7mb 19.7mb |
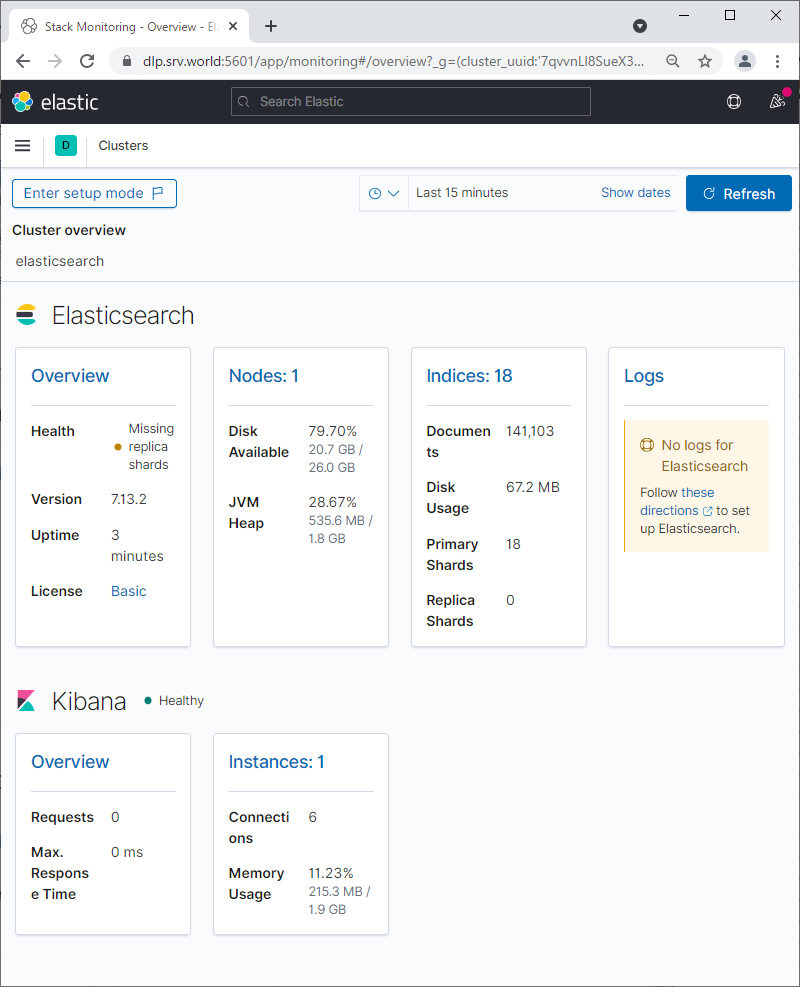
| [3] | If Kibana is running, you can find new data from Monitoring on Kibana, too. |
|
Matched Content