MicroK8s : Enable Fluentd2020/08/17 |
|
Enable Fluentd add-on to configure Elasticsearch, Fluentd, Kibana (EFK Stack) on MicroK8s Cluster.
|
| [1] | Enable built-in Fluentd add-on on primary Node. |
|
[root@dlp ~]# microk8s enable fluentd dns Enabling Fluentd-Elasticsearch Labeling nodes node/dlp.srv.world labeled Enabling DNS Applying manifest serviceaccount/coredns created configmap/coredns created deployment.apps/coredns created service/kube-dns created clusterrole.rbac.authorization.k8s.io/coredns created clusterrolebinding.rbac.authorization.k8s.io/coredns created Restarting kubelet DNS is enabled service/elasticsearch-logging created serviceaccount/elasticsearch-logging created clusterrole.rbac.authorization.k8s.io/elasticsearch-logging created clusterrolebinding.rbac.authorization.k8s.io/elasticsearch-logging created statefulset.apps/elasticsearch-logging created configmap/fluentd-es-config-v0.1.5 created serviceaccount/fluentd-es created clusterrole.rbac.authorization.k8s.io/fluentd-es created clusterrolebinding.rbac.authorization.k8s.io/fluentd-es created daemonset.apps/fluentd-es-v2.2.0 created deployment.apps/kibana-logging created service/kibana-logging created Fluentd-Elasticsearch is enabled Addon dns is already enabled.[root@dlp ~]# microk8s kubectl get services -n kube-system NAME TYPE CLUSTER-IP EXTERNAL-IP PORT(S) AGE elasticsearch-logging ClusterIP 10.152.183.119 <none> 9200/TCP 54s kibana-logging ClusterIP 10.152.183.237 <none> 5601/TCP 54s kube-dns ClusterIP 10.152.183.10 <none> 53/UDP,53/TCP,9153/TCP 70s[root@dlp ~]# microk8s kubectl get pods -A NAMESPACE NAME READY STATUS RESTARTS AGE kube-system coredns-588fd544bf-jfwv2 1/1 Running 0 97s kube-system elasticsearch-logging-0 1/1 Running 0 81s kube-system fluentd-es-v2.2.0-gvf69 1/1 Running 0 81s kube-system kibana-logging-84f486f46b-v5ts4 1/1 Running 0 81s[root@dlp ~]# microk8s kubectl cluster-info Kubernetes master is running at https://127.0.0.1:16443 Elasticsearch is running at https://127.0.0.1:16443/api/v1/namespaces/kube-system/services/elasticsearch-logging/proxy Kibana is running at https://127.0.0.1:16443/api/v1/namespaces/kube-system/services/kibana-logging/proxy CoreDNS is running at https://127.0.0.1:16443/api/v1/namespaces/kube-system/services/kube-dns:dns/proxy Metrics-server is running at https://127.0.0.1:16443/api/v1/namespaces/kube-system/services/https:metrics-server:/proxy # run kube proxy # replace access permission for your needs [root@dlp ~]# microk8s kubectl proxy --address=0.0.0.0 --accept-hosts=.* Starting to serve on [::]:8001 # if Firewalld is running, allow ports [root@dlp ~]# firewall-cmd --add-port=8001/tcp --permanent [root@dlp ~]# firewall-cmd --reload |
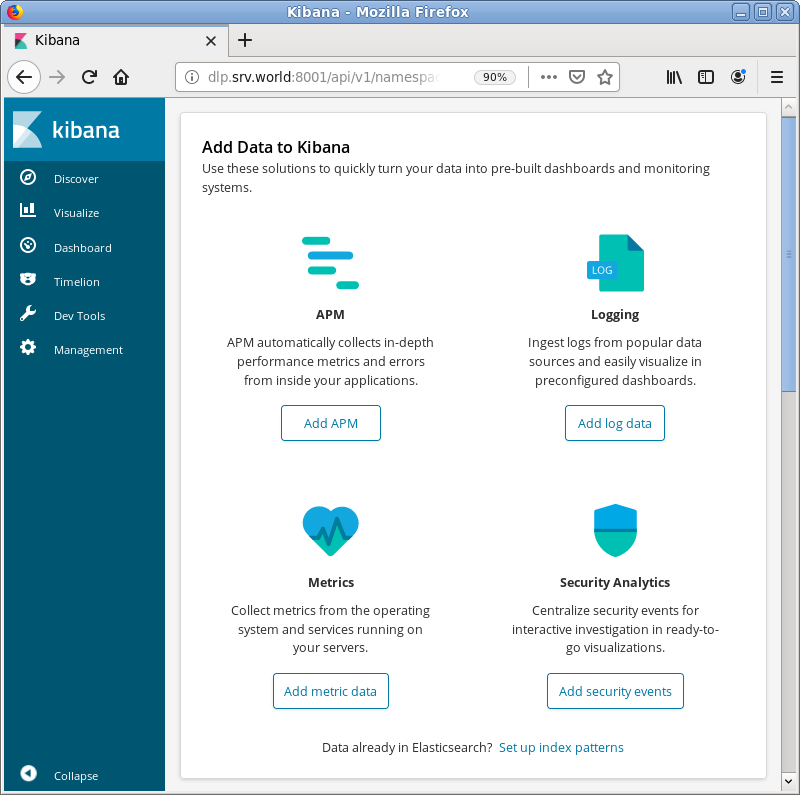
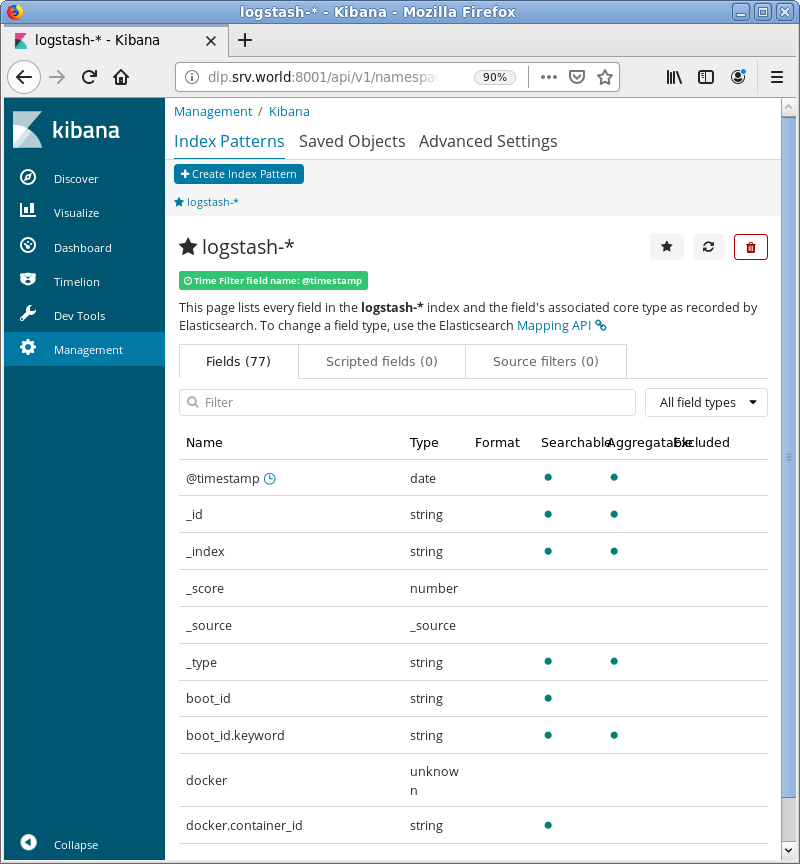
| [2] | Access to [https://(MicroK8s primary node's Hostname or IP address):8001/api/v1/namespaces/kube-system/services/kibana-logging/proxy] with an web browser on a Client computer in local network. Then, that's OK if following Kibana Dashboard is shown. |
|
|
Matched Content