Sensu : Visualize with Grafana2017/11/07 |
|
Visualize metrics data saved in Graphite with Grafana.
Because it's also possible to see Graphs on Graphite, this example is optional. |
|
| [1] |
Install Grafana, refer to here.
For listening port, Grafana's default port is [3000], and also Uchiwa's one is also 3000, so change Grafana's port to another one. On this example, changed to 3001 port. |
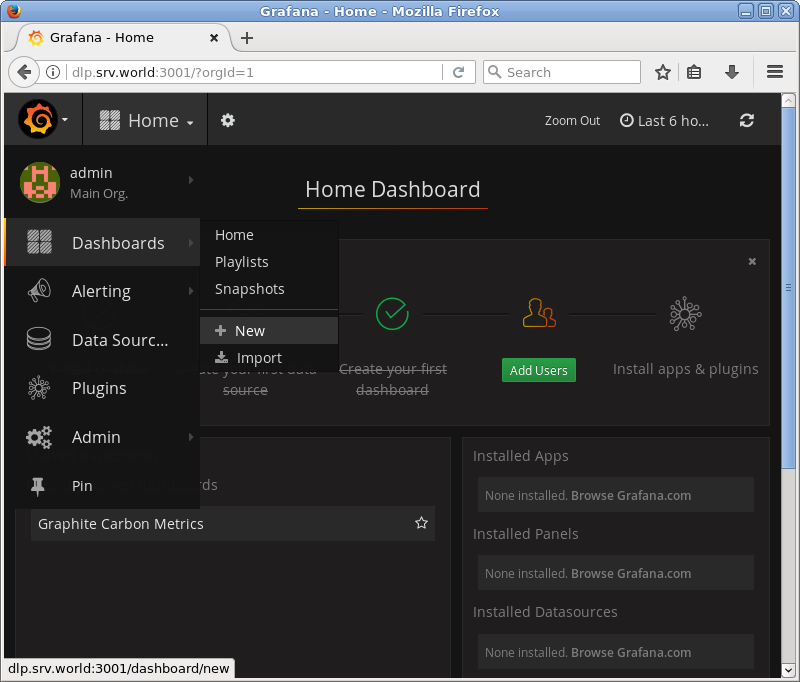
| [2] | Access to Grafana Web and select [Dashboards] - [New]. |
|
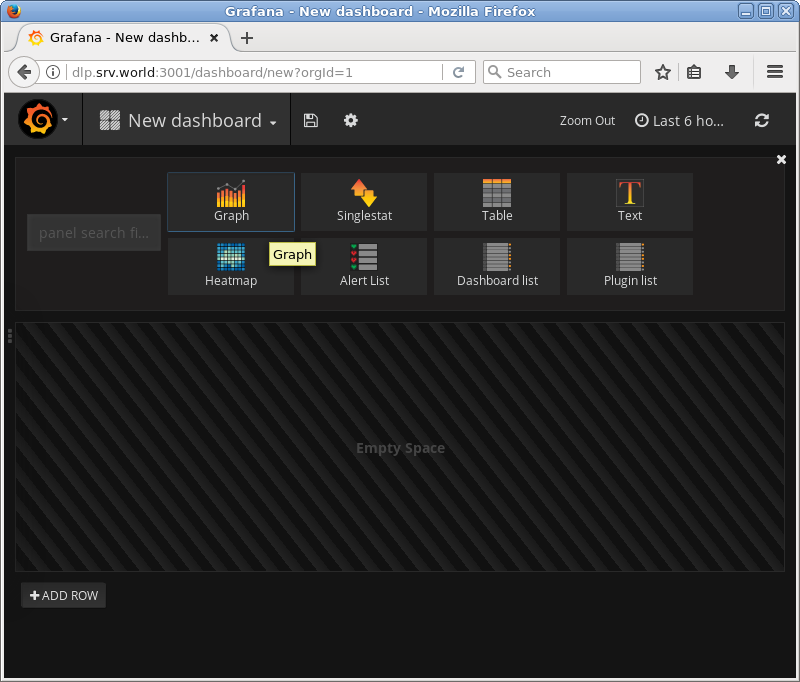
| [3] | Click [Graph] icon. |
|
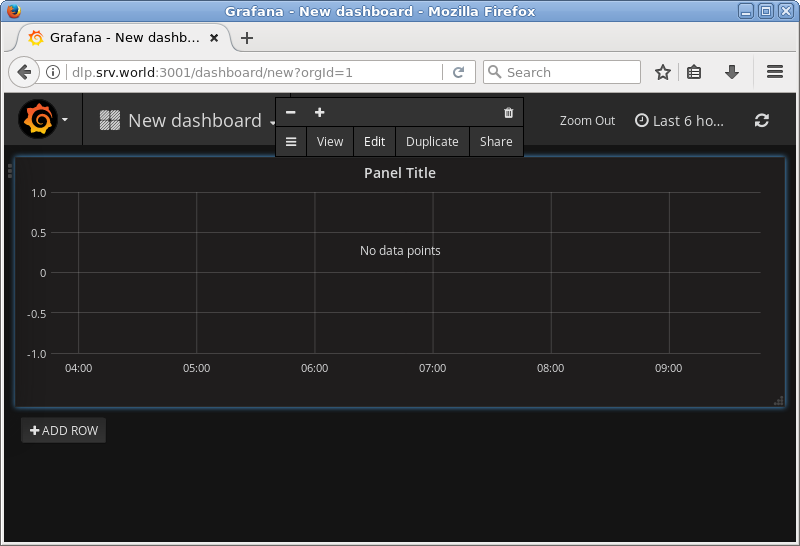
| [4] | Click [Panel Title], then selection is shown like follows, then click [Edit] button. |
|
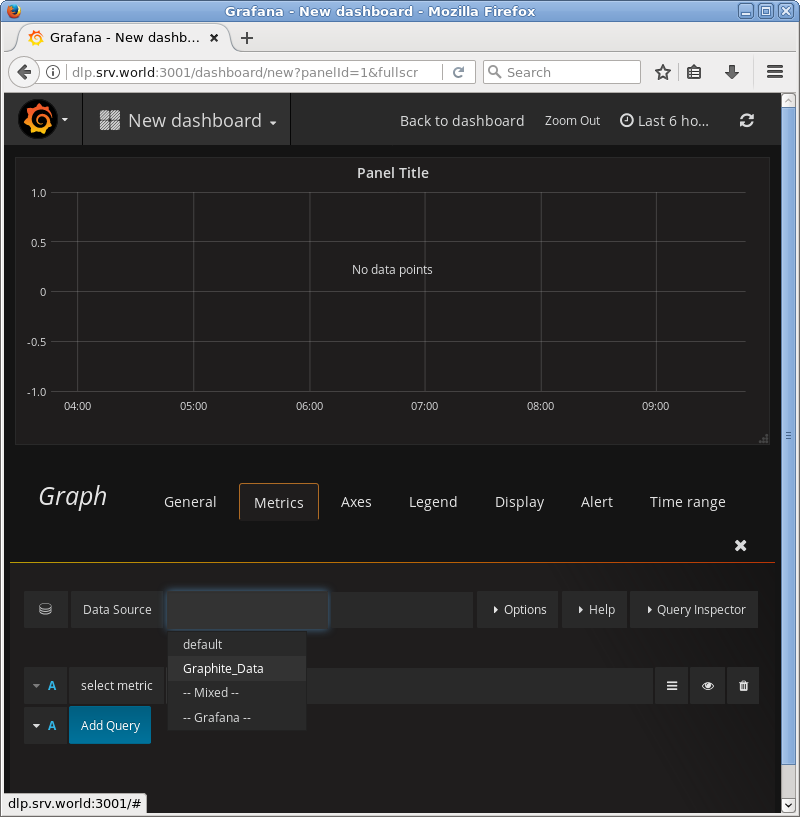
| [5] | Select [Graphite Data] on [Data Source] selection. |
|
| [6] | Click [Select Metric] to show selection, then select data source you'd like to set. |
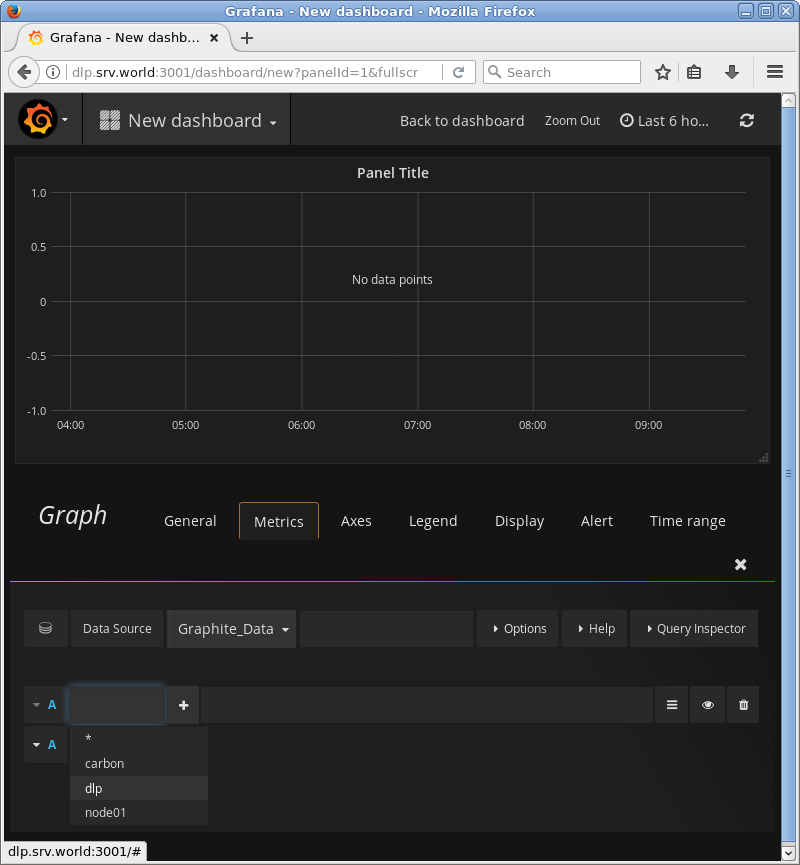
|
| [7] | According to data structure, more [Select Metric] button is shown, select data source again you'd like to set. |

|
| [8] | Select data source again and again you'd like to set. |
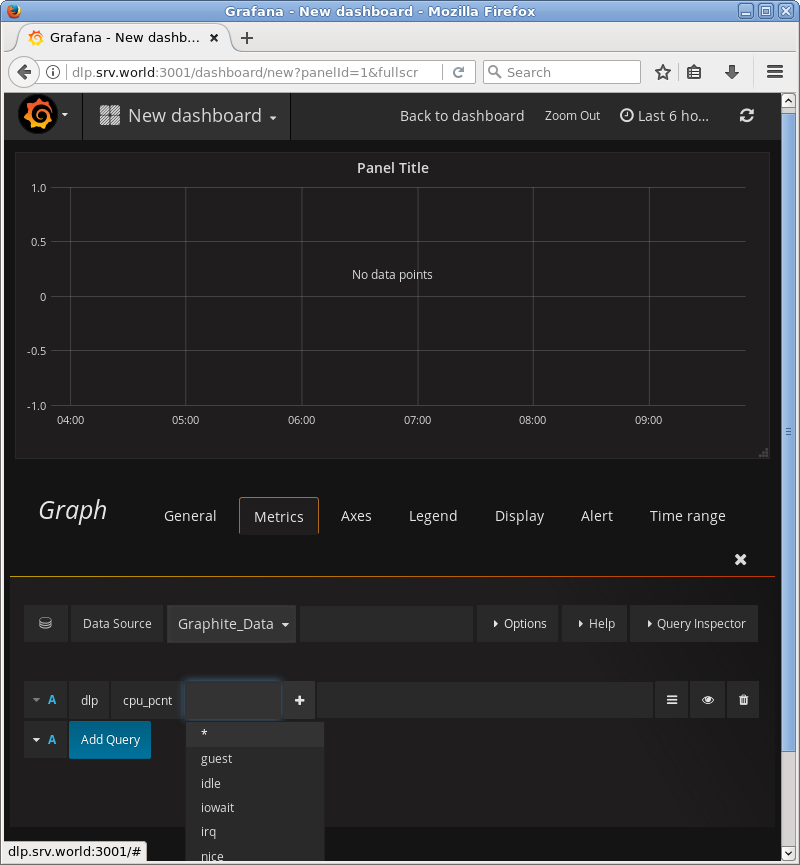
|
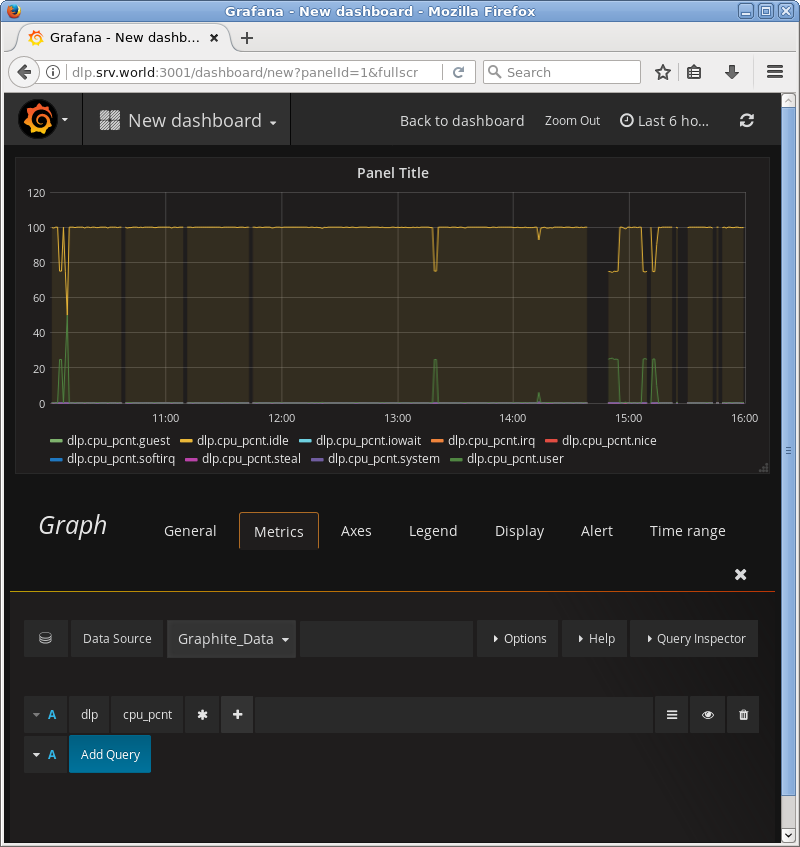
| [9] | To select all data source, Graphs are shown like follows. If it's OK, move to [General] tab on the left-side. |
|
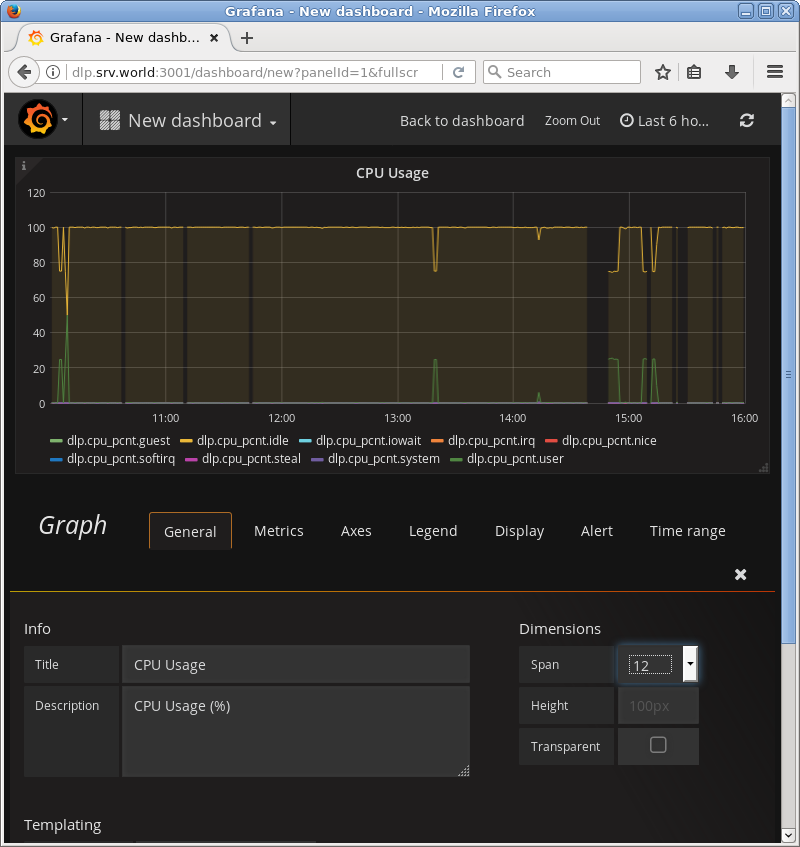
| [10] | Input the panel title and description. Next, click [Back to dashboard] button on the top. |
|
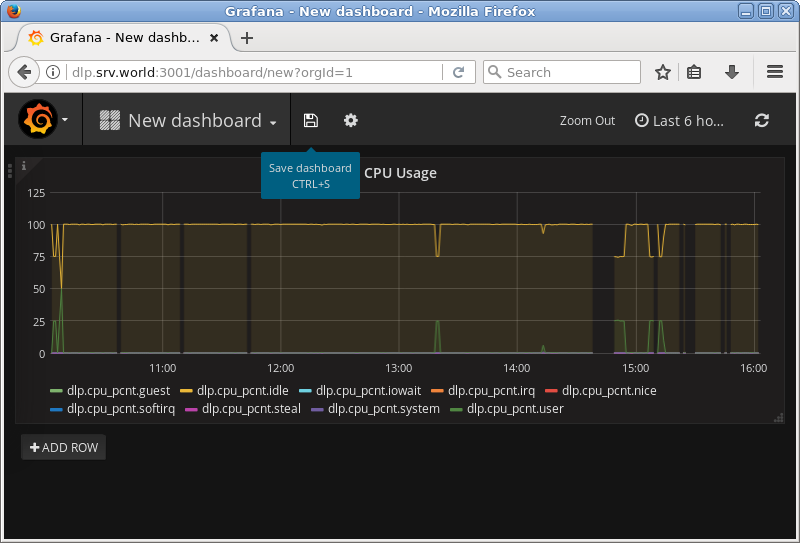
| [11] | Click Save icon on the top to save Dashboard settings. |
|
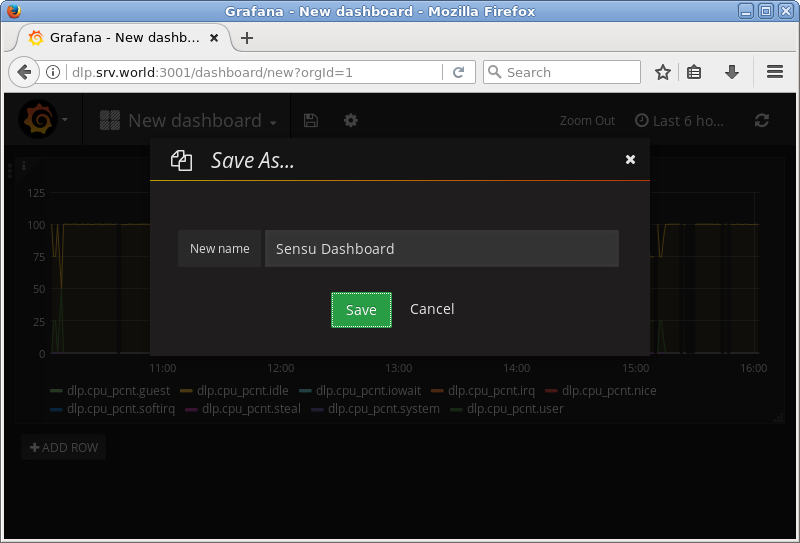
| [12] | Click [Save] button to save. |
|
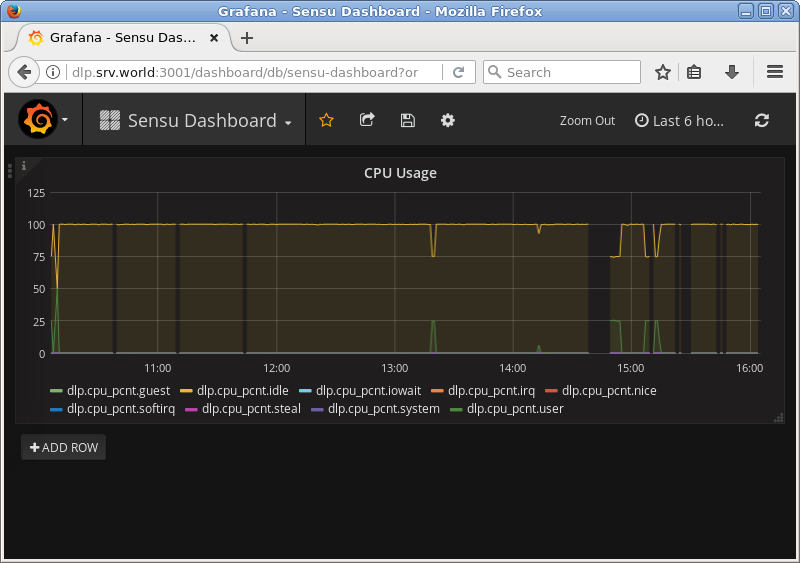
| [13] | It's OK. You can see Graphs on Grafana save on Graphite database. |
|
Matched Content