Elastic Stack 7 : Install Logstash2019/06/18 |
|
Install Logstash which collects or manages various logs.
For description of Logstash or how to write the setting file, refer to official site below.
⇒ https://www.elastic.co/guide/en/logstash/current/index.html |
|
| [1] | Install Logstash. Configure Repository for Elasticsearch before it like here. |
|
[root@dlp ~]# yum -y install logstash
|
| [2] | Create a setting file and start Logstash. For example, create a setting that Logstash collects sshd fail logs from [/var/log/secure]. |
|
[root@dlp ~]#
vi /etc/logstash/conf.d/sshd.conf # create new # extract sshd fail logs from [/var/log/secure] and output to index [sshd_fail-yyyy.mm] in elasticsearch
input {
  file {
    type => "seucure_log"
    path => "/var/log/secure"
  }
}
filter {
  grok {
    add_tag => [ "sshd_fail" ]
    match => { "message" => "Failed %{WORD:sshd_auth_type} for %{USERNAME:sshd_invalid_user} from %{IP:sshd_client_ip} port %{NUMBER:sshd_port} %{GREEDYDATA:sshd_protocol}" }
  }
}

output {
  elasticsearch {
    index => "sshd_fail-%{+YYYY.MM}"
  }
}
chgrp logstash /var/log/secure [root@dlp ~]# chmod 640 /var/log/secure [root@dlp ~]# systemctl start logstash [root@dlp ~]# systemctl enable logstash
|
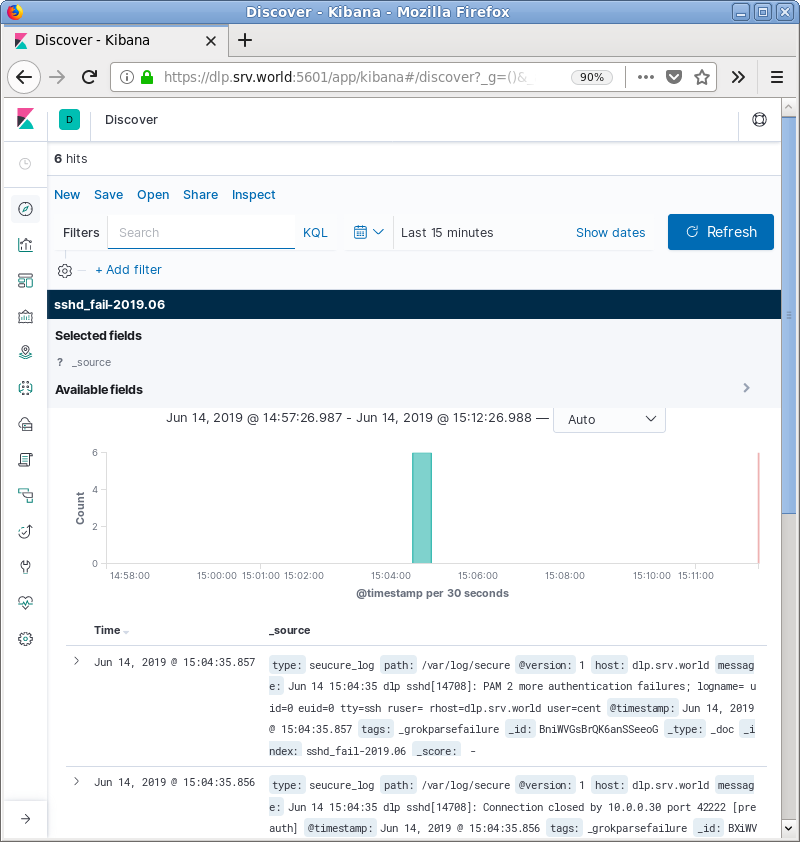
| [3] | Few minutes later, make sure logs are collected normally. |
|
# show index list [root@dlp ~]# curl localhost:9200/_cat/indices?v health status index uuid pri rep docs.count docs.deleted store.size pri.store.size yellow open sshd_fail-2019.06 Q689hZJTTjG6beQ6XtZsXw 1 1 6 0 49.9kb 49.9kb green open .kibana_1 OD2lQaCLQFeG7RQbYXigEA 1 0 4 0 17.5kb 17.5kb yellow open test_index u5nanOeOSCmGbSIlrqluZA 1 1 1 0 5.2kb 5.2kb green open .kibana_task_manager yuJ1nGaBSDeoeP6GToztbg 1 0 2 0 45.6kb 45.6kb # show document list on index [root@dlp ~]# curl localhost:9200/sshd_fail-2019.06/_search?pretty
{
  "took" : 6,
  "timed_out" : false,
  "_shards" : {
    "total" : 1,
    "successful" : 1,
    "skipped" : 0,
    "failed" : 0
  },
  "hits" : {
    "total" : {
      "value" : 6,
      "relation" : "eq"
    },
    "max_score" : 1.0,
    "hits" : [
      {
        "_index" : "sshd_fail-2019.06",
        "_type" : "_doc",
        "_id" : "AniWVGsBrQK6anSSZupA",
        "_score" : 1.0,
        "_source" : {
          "type" : "seucure_log",
          "path" : "/var/log/secure",
          "@version" : "1",
          "host" : "dlp.srv.world",
.....
.....
|
| [4] | If Kibana is running, To add the Index in Kibana, data is imported in it and possible to create visualization you like. |
|
Matched Content