Elastic Stack 6 : Install Heartbeat2018/02/12 |
|
Install Heartbeat that can monitor services for their availability with active probing.
|
|
| [1] | Install Heartbeat. Configure Elasticsearch repository before it. |
|
[root@dlp ~]# yum -y install heartbeat-elastic
|
| [2] | Configure basic settings and start Heartbeat. |
|
[root@dlp ~]#
vi /etc/heartbeat/heartbeat.yml # line 13: set items # by default, monitored the URL http://localhost:9200 like follows heartbeat.monitors: - type: http # List or urls to query urls: ["http://localhost:9200"] # Configure task schedule schedule: '@every 10s' # Total test connection and data exchange timeout #timeout: 16s ..... ..... # line 70: if use Kibana, uncomment and specify output host # if SSL is enabled on Kibana, hostname should be the same with the hostname in certs
setup.kibana:
.....
  host: "https://dlp.srv.world:5601"
# line 90: specify output host # the default is localhost's Elasticsearch # if output to Logstash, comment out Elasticsearch and uncomment logstash lines output.elasticsearch: # Array of hosts to connect to.l hosts: ["localhost:9200"] ..... ..... #output.logstash: # The Logstash hosts #hosts: ["localhost:5044"]
[root@dlp ~]#
vi /etc/heartbeat/heartbeat.reference.yml # line 14: bt default, monitored localhost with ICMP every 5 min
heartbeat.monitors:
- type: icmp # monitor type `icmp` (requires root) uses ICMP Echo Request to ping
             # configured hosts

  # Monitor name used for job name and document type.
  #name: icmp

  # Enable/Disable monitor
  #enabled: true

  # Configure task schedule using cron-like syntax
  schedule: '*/5 * * * * * *' # exactly every 5 seconds like 10:00:00, 10:00:05,...

  # List of hosts to ping
  hosts: ["localhost"]

.....
.....
# line 65: TCP monitoring section
- type: tcp # monitor type `tcp`. Connect via TCP and optionally verify endpoint
            # by sending/receiving a custom payload

  # Monitor name used for job name and document type
  #name: tcp

  # Enable/Disable monitor
  #enabled: true

  # Configure task schedule
  schedule: '@every 5s' # every 5 seconds from start of beat

.....
.....

  hosts: ["localhost:9200"]
.....
.....
[root@dlp ~]# systemctl start heartbeat-elastic [root@dlp ~]# systemctl enable heartbeat-elastic
|
| [3] | Make sure the data has been collected normally. |
|
# index list [root@dlp ~]# curl localhost:9200/_cat/indices?v health status index uuid pri rep docs.count docs.deleted store.size pri.store.size yellow open filebeat-6.2.1-2018.02.14 uzqg8... 3 1 30106 0 4mb 4mb yellow open sshd_fail-2018.02 ghhQe... 5 1 65 0 240.4kb 240.4kb yellow open packetbeat-6.2.1-2018.02.14 -O8vG... 3 1 4912 0 1.4mb 1.4mb green open .kibana sV0Ds... 1 0 372 0 384.9kb 384.9kb yellow open test_index CIPjY... 5 1 1 0 6kb 6kb yellow open heartbeat-6.2.1-2018.02.14 29OqT... 1 1 1 0 10.9kb 10.9kb yellow open metricbeat-6.2.1-2018.02.14 OhrZT... 1 1 29886 0 5.3mb 5.3mb # document list on the index [root@dlp ~]# curl localhost:9200/heartbeat-6.2.1-2018.02.14/_search?pretty
{
  "took" : 4,
  "timed_out" : false,
  "_shards" : {
    "total" : 1,
    "successful" : 1,
    "skipped" : 0,
    "failed" : 0
  },
  "hits" : {
    "total" : 7,
    "max_score" : 1.0,
    "hits" : [
      {
        "_index" : "heartbeat-6.2.1-2018.02.14",
        "_type" : "doc",
.....
.....
|
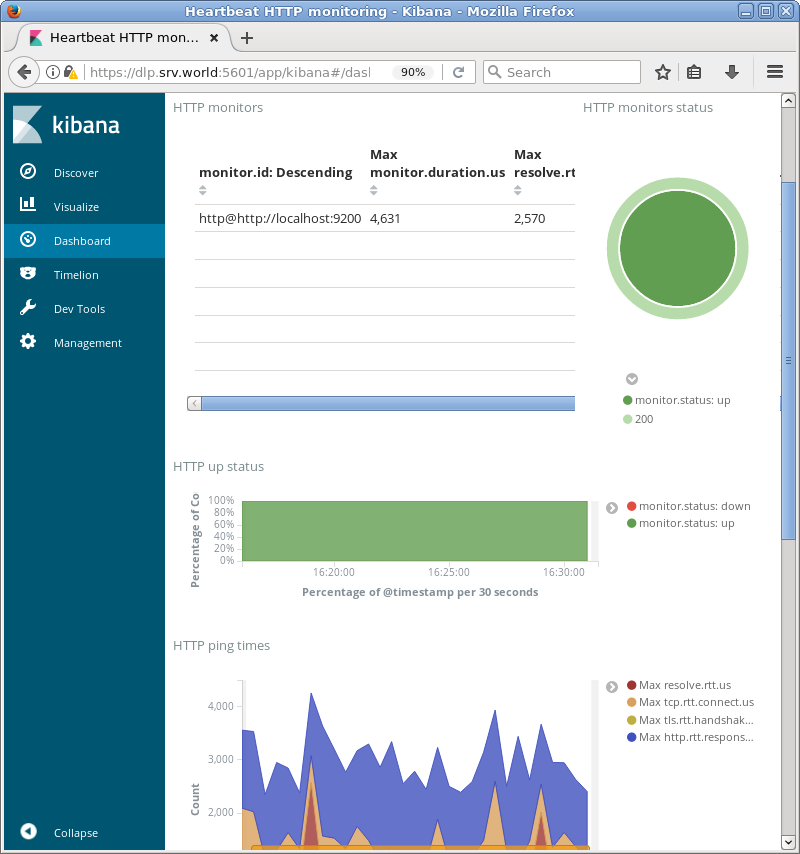
| [4] | If Kibana is running, it's possible to import data to sample Dashboards. |
|
[root@dlp ~]# heartbeat setup --dashboards Loaded dashboards |
|
Matched Content