Elastic Stack 6 : Install Packetbeat2018/02/12 |
|
Install Packetbeat that collects and analyze Network packets.
|
|
| [1] | Install Packetbeat. Configure Elasticsearch repository before it. |
|
[root@dlp ~]# yum -y install packetbeat
|
| [2] | Configure basic settings and start Packetbeat. |
|
[root@dlp ~]#
vi /etc/packetbeat/packetbeat.yml # line 29: set items to collect data # if disable ICMPv4/ICMPv6, turn to false # line 34 and later : many items are targeted as monitoring by default, # but if not need, comment out the line [ports: ***] packetbeat.protocols: - type: icmp # Enable ICMPv4 and ICMPv6 monitoring. Default: false enabled: true - type: amqp # Configure the ports where to listen for AMQP traffic. You can disable # the AMQP protocol by commenting out the list of ports. ports: [5672] ..... ..... # line 146: if use Kibana, uncomment and specify output host # if SSL is enabled on Kibana, hostname should be the same with the hostname in certs
setup.kibana:
.....
  host: "https://dlp.srv.world:5601"
# line 166: specify output host # the default is localhost's Elasticsearch # if output to Logstash, comment out Elasticsearch and uncomment logstash lines output.elasticsearch: # Array of hosts to connect to.l hosts: ["localhost:9200"] ..... ..... #output.logstash: # The Logstash hosts #hosts: ["localhost:5044"]
[root@dlp ~]#
vi /etc/packetbeat/packetbeat.reference.yml # line 1172: if use Kibana, uncomment and specify output host # if SSL is enabled on Kibana, uncomment ssl related lines # if your certs is self-siged one, ssl.verification_mode should be "none" setup.kibana: # Kibana Host # Scheme and port can be left out and will be set to the default (http and 5601) # In case you specify and additional path, the scheme is required: http://localhost:5601/path # IPv6 addresses should always be defined as: https://[2001:db8::1]:5601 host: "dlp.srv.world:5601" # Optional protocol and basic auth credentials. protocol: "https" #username: "elastic" #password: "changeme" # Optional HTTP Path #path: "" # Use SSL settings for HTTPS. Default is true. ssl.enabled: true # Configure SSL verification mode. If `none` is configured, all server hosts # and certificates will be accepted. In this mode, SSL based connections are # susceptible to man-in-the-middle attacks. Use only for testing. Default is # `full`. ssl.verification_mode: none[root@dlp ~]# systemctl start packetbeat [root@dlp ~]# systemctl enable packetbeat
|
| [3] | Make sure the data has been collected normally. |
|
# index list [root@dlp ~]# curl localhost:9200/_cat/indices?v health status index uuid pri rep docs.count docs.deleted store.size pri.store.size yellow open packetbeat-6.2.1-2... -O8vGFW... 3 1 0 0 230b 230b yellow open sshd_fail-2018.02 ghhQeNG... 5 1 19 0 150.7kb 150.7kb yellow open test_index CIPjYsY... 5 1 1 0 6kb 6kb green open .kibana sV0DskL... 1 0 126 7 339.5kb 339.5kb yellow open metricbeat-6.2.1-2... OhrZTh1... 1 1 22818 0 8.3mb 8.3mb # document list on the index [root@dlp ~]# curl localhost:9200/packetbeat-6.2.1-2018.02.14/_search?pretty
{
  "took" : 8,
  "timed_out" : false,
  "_shards" : {
    "total" : 3,
    "successful" : 3,
    "skipped" : 0,
    "failed" : 0
  },
  "hits" : {
    "total" : 37,
    "max_score" : 1.0,
    "hits" : [
      {
        "_index" : "packetbeat-6.2.1-2018.02.14",
        "_type" : "doc",
.....
.....
|
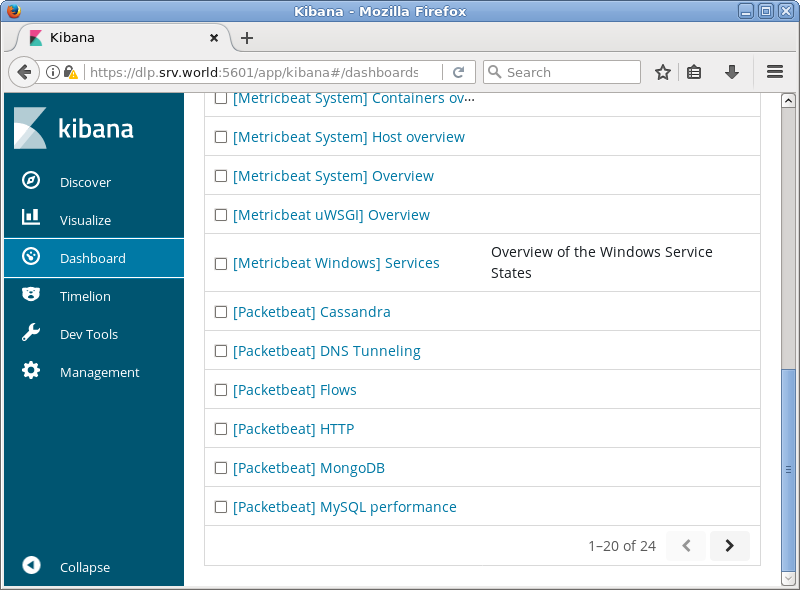
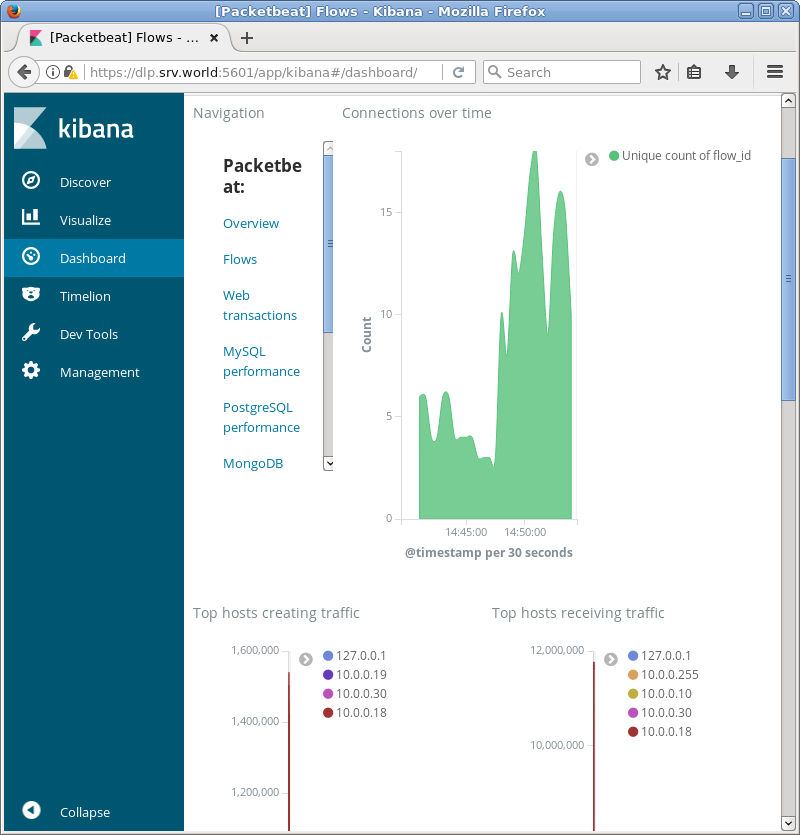
| [4] | If Kibana is running, it's possible to import data to sample Dashboards. |
|
[root@dlp ~]# packetbeat setup --dashboards Loaded dashboards |
|
|
Matched Content