Elastic Stack 6 : Install Metricbeat2018/02/12 |
|
Install Metricbeat that collectes metrics from System or Services.
For details, refer to the official site.
⇒ https://www.elastic.co/guide/en/beats/metricbeat/current/metricbeat-modules.html |
|
| [1] | Install Metricbeat. Configure Elasticsearch repository before it. |
|
[root@dlp ~]# yum -y install metricbeat
|
| [2] | Configure basic settings and start Metricbeat. |
|
[root@dlp ~]#
vi /etc/metricbeat/metricbeat.yml # line 67: if use Kibana, uncomment and specify output host # if SSL is enabled on Kibana, hostname should be the same with the hostname in certs
setup.kibana:
.....
  host: "https://dlp.srv.world:5601"
# line 87: specify output host # the default is localhost's Elasticsearch # if output to Logstash, comment out Elasticsearch and uncomment logstash lines output.elasticsearch: # Array of hosts to connect to. hosts: ["localhost:9200"] ..... ..... #output.logstash: # The Logstash hosts #hosts: ["localhost:5044"]
[root@dlp ~]#
vi /etc/metricbeat/metricbeat.reference.yml # line 51: set items to collect data # enable and disable to comment out and uncomment
- module: system
  metricsets:
    - cpu             # CPU usage
    - filesystem      # File system usage for each mountpoint
    - fsstat          # File system summary metrics
    - load            # CPU load averages
    - memory          # Memory usage
    - network         # Network IO
    - process         # Per process metrics
    - process_summary # Process summary
    - uptime          # System Uptime
    #- core           # Per CPU core usage
    #- diskio         # Disk IO
    #- socket         # Sockets and connection info (linux only)
# line 1172: if use Kibana, uncomment and specify output host # if SSL is enabled on Kibana, uncomment ssl related lines # if your certs is self-siged one, ssl.verification_mode should be "none" setup.kibana: # Kibana Host # Scheme and port can be left out and will be set to the default (http and 5601) # In case you specify and additional path, the scheme is required: http://localhost:5601/path # IPv6 addresses should always be defined as: https://[2001:db8::1]:5601 host: "dlp.srv.world:5601" # Optional protocol and basic auth credentials. protocol: "https" #username: "elastic" #password: "changeme" # Optional HTTP Path #path: "" # Use SSL settings for HTTPS. Default is true. ssl.enabled: true # Configure SSL verification mode. If `none` is configured, all server hosts # and certificates will be accepted. In this mode, SSL based connections are # susceptible to man-in-the-middle attacks. Use only for testing. Default is # `full`. ssl.verification_mode: none[root@dlp ~]# systemctl start metricbeat [root@dlp ~]# systemctl enable metricbeat
|
| [3] | Make sure the data has been collected normally. |
|
# index list [root@dlp ~]# curl localhost:9200/_cat/indices?v health status index uuid pri rep docs.count docs.deleted store.size pri.store.size yellow open metricbeat-6.2.1-... 1wu4De... 1 1 498 0 219.7kb 219.7kb yellow open sshd_fail-2018.02 8becNs... 5 1 33 0 263.3kb 263.3kb green open .kibana poadDv... 1 0 2 1 11.2kb 11.2kb yellow open test_index ZtKext... 5 1 1 0 6kb 6kb # document list on the index [root@dlp ~]# curl localhost:9200/metricbeat-6.2.1-2018.02.13/_search?pretty
{
  "took" : 9,
  "timed_out" : false,
  "_shards" : {
    "total" : 1,
    "successful" : 1,
    "skipped" : 0,
    "failed" : 0
  },
  "hits" : {
    "total" : 561,
    "max_score" : 1.0,
    "hits" : [
      {
        "_index" : "metricbeat-6.2.1-2018.02.13",
        "_type" : "doc",
.....
.....
|
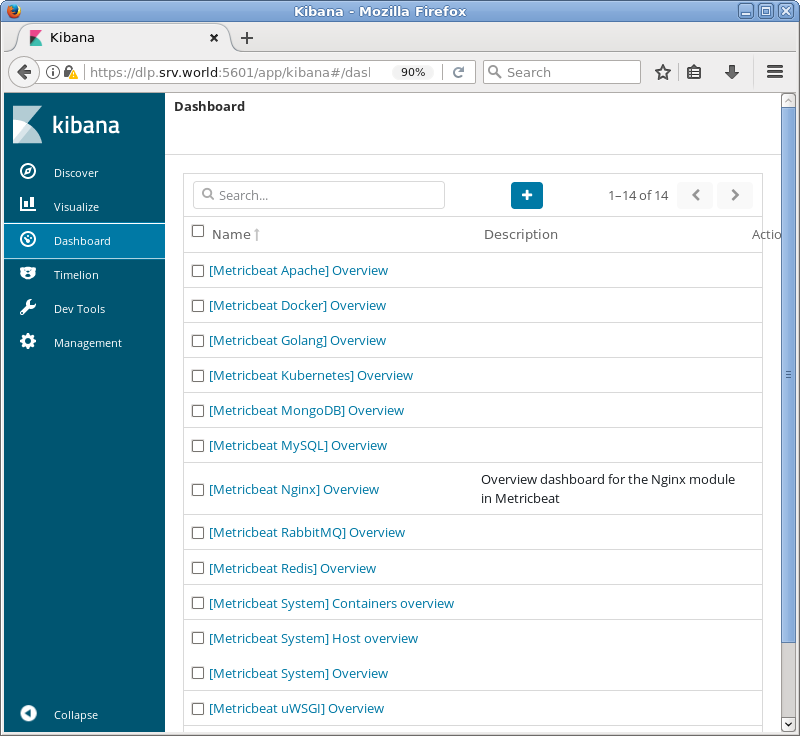
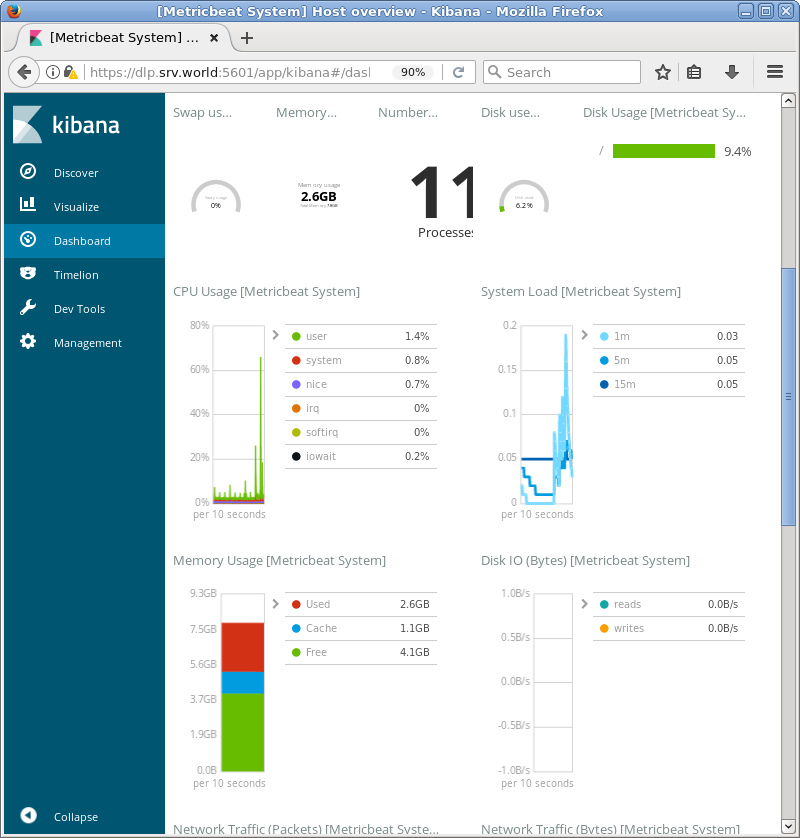
| [4] | If Kibana is running, it's possible to import data to sample Dashboards. |
|
[root@dlp ~]# metricbeat setup --dashboards Loaded dashboards |
|
|
Matched Content