Elastic Stack 6 : Install X-Pack2018/02/25 |
|
Install X-Pack which extends features of Elasticsearch or Kibana.
Most plugins included in X-Pack are not for free, so you mush buy licenses to use.
However, you can try to use for 30 days with trial license.
Refer to the official site about subscription below.
⇒ https://www.elastic.co/subscriptions |
|
| [1] | Install X-Pack for Elasticsearch on all Elasticsearch Nodes in Cluster. |
|
[root@dlp ~]# /usr/share/elasticsearch/bin/elasticsearch-plugin install x-pack -> Downloading x-pack from elastic [=================================================] 100% @@@@@@@@@@@@@@@@@@@@@@@@@@@@@@@@@@@@@@@@@@@@@@@@@@@@@@@@@@@ @ WARNING: plugin requires additional permissions @ @@@@@@@@@@@@@@@@@@@@@@@@@@@@@@@@@@@@@@@@@@@@@@@@@@@@@@@@@@@ * java.io.FilePermission \\.\pipe\* read,write * java.lang.RuntimePermission accessClassInPackage.com.sun.activation.registries * java.lang.RuntimePermission getClassLoader * java.lang.RuntimePermission setContextClassLoader * java.lang.RuntimePermission setFactory * java.net.SocketPermission * connect,accept,resolve * java.security.SecurityPermission createPolicy.JavaPolicy * java.security.SecurityPermission getPolicy * java.security.SecurityPermission putProviderProperty.BC * java.security.SecurityPermission setPolicy * java.util.PropertyPermission * read,write See http://docs.oracle.com/javase/8/docs/technotes/guides/security/permissions.html for descriptions of what these permissions allow and the associated risks. Continue with installation? [y/N] y @@@@@@@@@@@@@@@@@@@@@@@@@@@@@@@@@@@@@@@@@@@@@@@@@@@@@@@@@@@ @ WARNING: plugin forks a native controller @ @@@@@@@@@@@@@@@@@@@@@@@@@@@@@@@@@@@@@@@@@@@@@@@@@@@@@@@@@@@ This plugin launches a native controller that is not subject to the Java security manager nor to system call filters. Continue with installation? [y/N] y Elasticsearch keystore is required by plugin [x-pack-security], creating... -> Installed x-pack with: x-pack-core,x-pack-deprecation,x-pack-graph,x-pack-logstash, x-pack-ml,x-pack-monitoring,x-pack-security,x-pack-upgrade,x-pack-watcher |
| [2] | If Kibana is running, Install X-Pack for Kibana on Kibana installed Node, too. |
|
[root@dlp ~]# /usr/share/kibana/bin/kibana-plugin install x-pack Attempting to transfer from x-pack Attempting to transfer from https://artifacts.elastic.co/downloads/kibana-plugins/x-pack/x-pack-6.2.2.zip Transferring 269704442 bytes.................... Transfer complete Retrieving metadata from plugin archive Extracting plugin archive Extraction complete Optimizing and caching browser bundles... Plugin installation complete |
| [3] | If Logstash is running, Install X-Pack for Logstash on Logstash installed Node, too. |
|
[root@dlp ~]# /usr/share/logstash/bin/logstash-plugin install x-pack Downloading file: https://artifacts.elastic.co/downloads/logstash-plugins/x-pack/x-pack-6.2.2.zip Downloading [=============================================================] 100% Installing file: /tmp/studtmp-af3a51070a5bcce6ebfde84d3cca4bd4953756ae71755e99101218e6ac0d/x-pack-6.2.2.zip Install successful |
| [4] | Configure for X-Pack. Set like follows on all Elasticsearch Nodes in Cluster. On this example, Disable most features like Security first. If you enable them, refer to the next tutorial. About features of X-Pack, refer to the official site below. ⇒ https://www.elastic.co/guide/en/elasticsearch/reference/6.2/settings-xpack.html |
|
[root@dlp ~]#
vi /etc/elasticsearch/elasticsearch.yml # add to the end # set license type (follow is the trial license) xpack.license.self_generated.type: trial # set Monitoring (enabled) xpack.monitoring.enabled: true # set Security (disabled) xpack.security.enabled: false # set Watcher (disabled) xpack.watcher.enabled: false # set Machine learning (disabled) xpack.ml.enabled: false
[root@dlp ~]#
systemctl restart elasticsearch kibana logstash # access to show the index list ,then you can find new data from Monitoring [root@dlp ~]# curl localhost:9200/_cat/indices?v health status index uuid pri rep docs.count docs.deleted store.size ... green open test_index VfIZnk... 5 1 1 0 12.3kb ... green open .monitoring-logstash-6-2018.02.23 -AXqna... 1 1 806 0 209.3kb ... green open .monitoring-kibana-6-2018.02.25 itNQ-g... 1 1 76 0 137.4kb ... green open .monitoring-es-6-2018.02.23 CiewsT... 1 1 4082 52 4.9mb ... green open sshd_fail-2018.02 1KDc16... 5 1 23 0 329.8kb ... green open .monitoring-es-6-2018.02.25 w9Fm71... 1 1 1075 32 1.7mb ... green open .monitoring-logstash-6-2018.02.25 9JqBNG... 1 1 534 0 274.7kb ... green open .monitoring-kibana-6-2018.02.23 hnxoh-... 1 1 110 0 112.4kb ... |
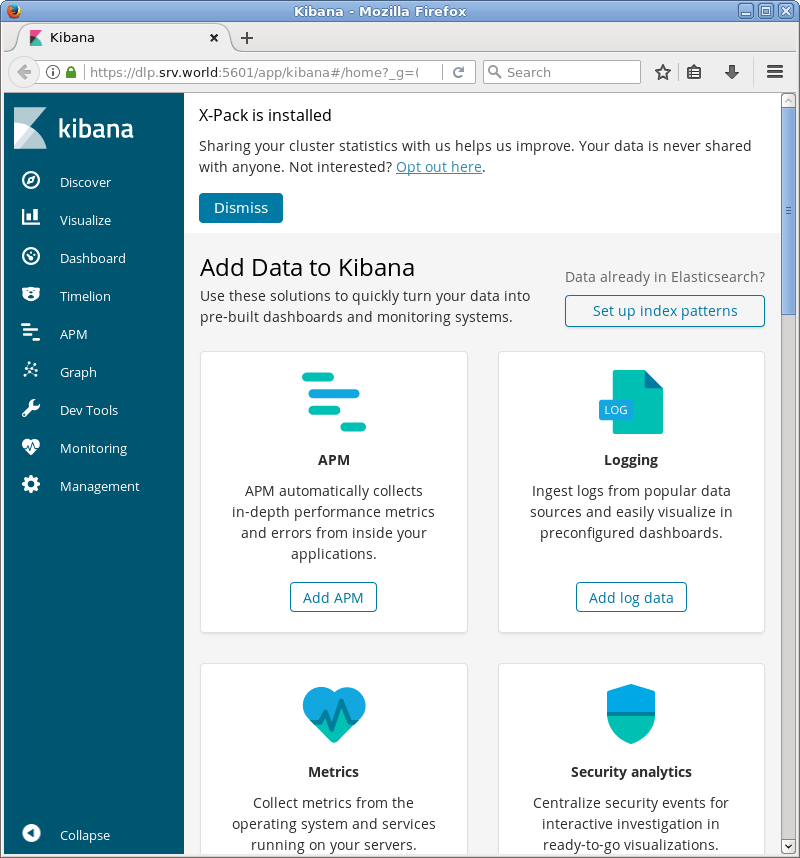
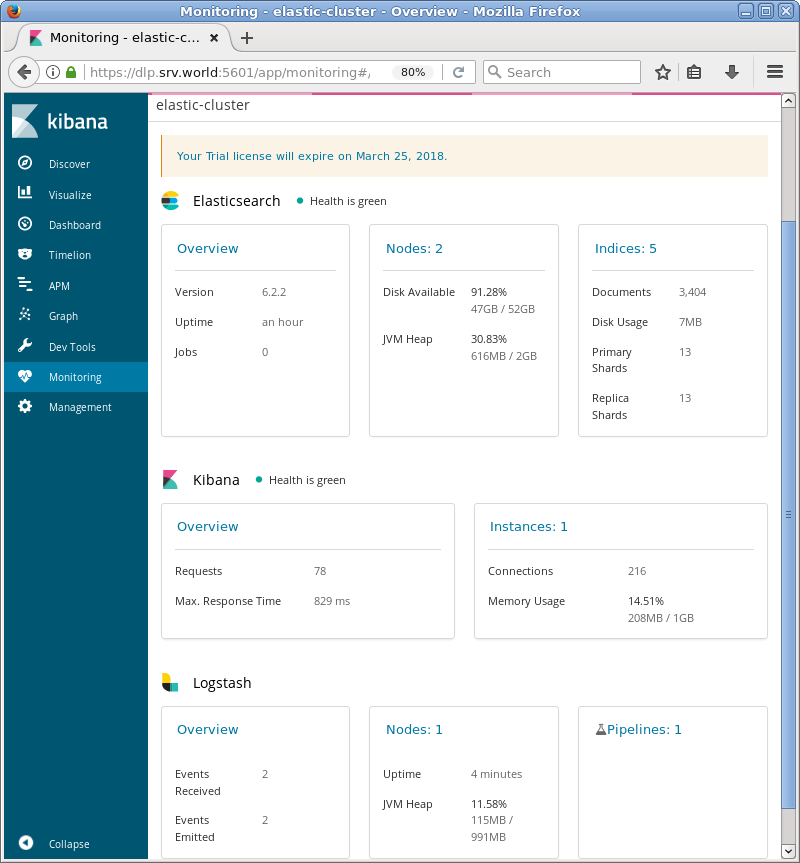
| [5] | If Kibana is running, you can find new data from Monitoring on Kibana, too. |
|
|
Matched Content