Elastic Stack 6 : Install Winlogbeat2018/02/12 |
|
Install Winlogbeat that ships Windows ivent logs to Elasticsearch or Logstash.
This example is based on the environment like follows.
+----------------------+ | +----------------------+ | [ dlp.srv.world ] |10.0.0.30 | 10.0.0.100| [ fd3s.srv.world ] | | Elasticsearch +----------+-----------+ Winlogbeat | | (CentOS 7) | | (Windows 2016) | +----------------------+ +----------------------+ |
| [1] |
Download Winlogbeat from the pfficial site below on a Windows Server.
⇒ https://www.elastic.co/jp/downloads/beats/winlogbeat |
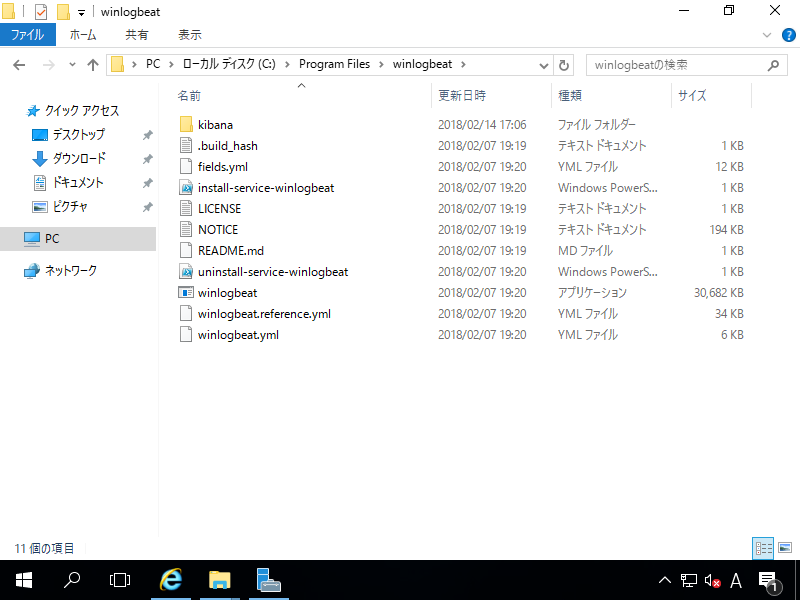
| [2] | After downloading, extract the file and rename and move to a folder you like. On this example, locate [C:\Program Files\winlogbeat] like follows. |
|
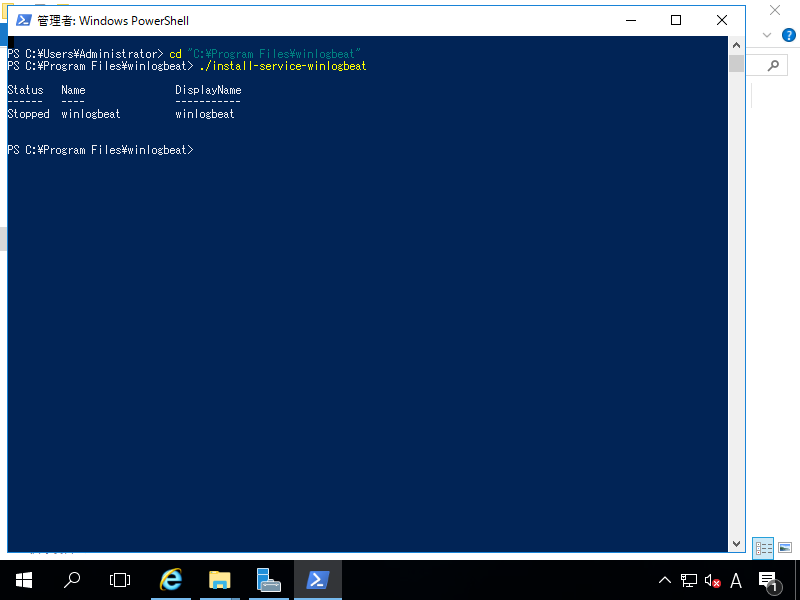
| [3] | Run Powershell and add Winlogbeat service like follows. PS > cd "C:\Program Files\winlogbeat" PS > ./install-service-winlogbeat.ps1 |
|
| [4] | Open the setting file and edit it. ⇒ [C:\Program Files\winlogbeat\winlogbeat.yml] |
# line 20: set items
winlogbeat.event_logs:
  - name: Application
    ignore_older: 72h
  - name: Security
  - name: System

.....
.....

# line 65: if use Kibana, uncomment and specify output host
# if SSL is enabled on Kibana, hostname should be the same with the hostname in certs
setup.kibana:
.....
  host: https://dlp.srv.world:5601

.....
.....

# line 91: specify output host
# if output to Logstash, comment out Elasticsearch and uncomment logstash lines
output.elasticsearch:
  # Array of hosts to connect to.
  hosts: ["dlp.srv.world:9200"]

.....
.....

#output.logstash:
  # The Logstash hosts
  #hosts: ["localhost:5044"]
|
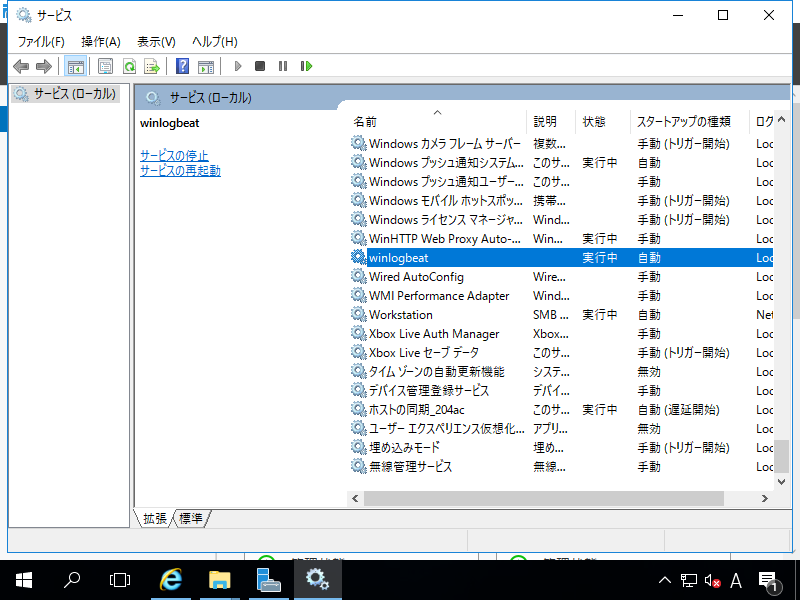
| [5] | After finishing configuration, Start Winlogbeat service. |
|
| [6] | Make sure the data has been collected normally on Elasticsearch Server. |
|
# index list [root ~]# curl localhost:9200/_cat/indices?v health status index uuid pri rep docs.count docs.deleted store.size pri.store.size yellow open filebeat-6.2.1-2018.02.14 uzqg8... 3 1 30107 0 4mb 4mb yellow open sshd_fail-2018.02 ghhQe... 5 1 71 0 282.4kb 282.4kb yellow open packetbeat-6.2.1-2018.02.14 -O8vG... 3 1 11613 0 4.9mb 4.9mb green open .kibana sV0Ds... 1 0 412 0 496.3kb 496.3kb yellow open auditbeat-6.2.1-2018.02.14 aECFl... 3 1 1384 0 736.3kb 736.3kb yellow open winlogbeat-6.2.1-2018.02.14 7440J... 3 1 936 0 1mb 1mb yellow open test_index CIPjY... 5 1 1 0 6kb 6kb yellow open heartbeat-6.2.1-2018.02.14 29OqT... 1 1 428 0 264.9kb 264.9kb yellow open winlogbeat-6.2.1-2016.12.22 TU_OU... 3 1 128 0 196kb 196kb yellow open metricbeat-6.2.1-2018.02.14 OhrZT... 1 1 35453 0 12.7mb 12.7mb # document list on the index [root ~]# curl localhost:9200/winlogbeat-6.2.1-2016.12.22/_search?pretty
{
  "took" : 98,
  "timed_out" : false,
  "_shards" : {
    "total" : 3,
    "successful" : 3,
    "skipped" : 0,
    "failed" : 0
  },
  "hits" : {
    "total" : 128,
    "max_score" : 1.0,
    "hits" : [
      {
        "_index" : "winlogbeat-6.2.1-2016.12.22",
        "_type" : "doc",

.....
.....
|
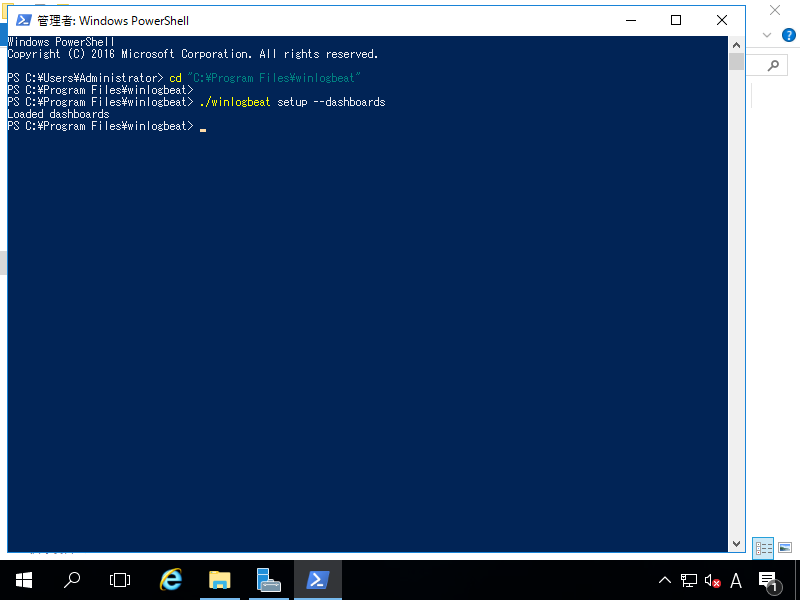
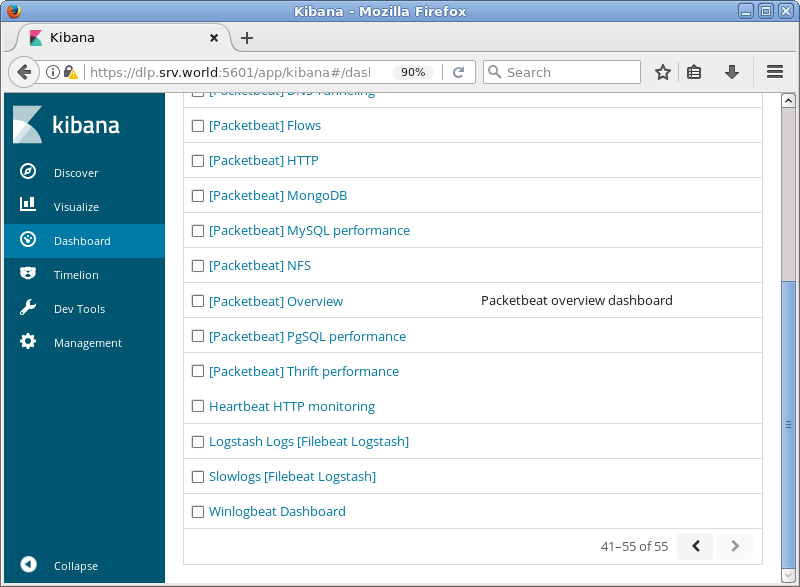
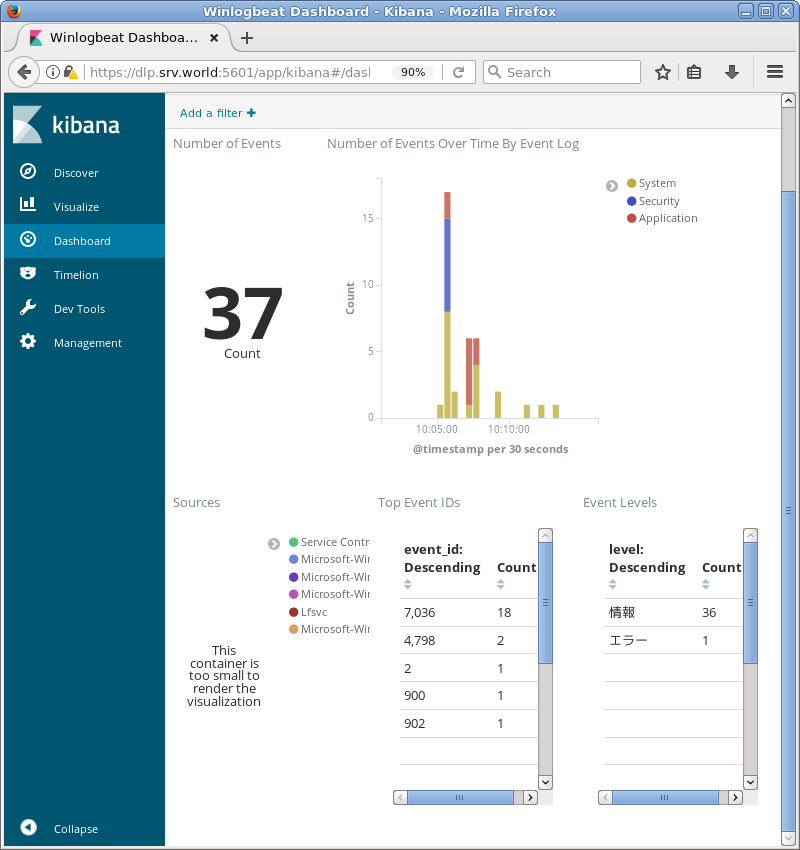
| [7] | If Kibana is running, it's possible to import data to sample Dashboards. PS > cd "C:\Program Files\winlogbeat" PS > ./winlogbeat setup --dashboards |
|
|
|
Matched Content