Sensu : Add Check Plugins (Windows)2017/11/08 |
|
Check plugins for Windows are also provided, so it's possible to check General items like CPU or memory and others.
|
|
| [1] |
Download Sensu plugin for Windows on target Windows host from Sensu Plugins Project.
⇒ https://github.com/sensu-plugins/sensu-plugins-windows |
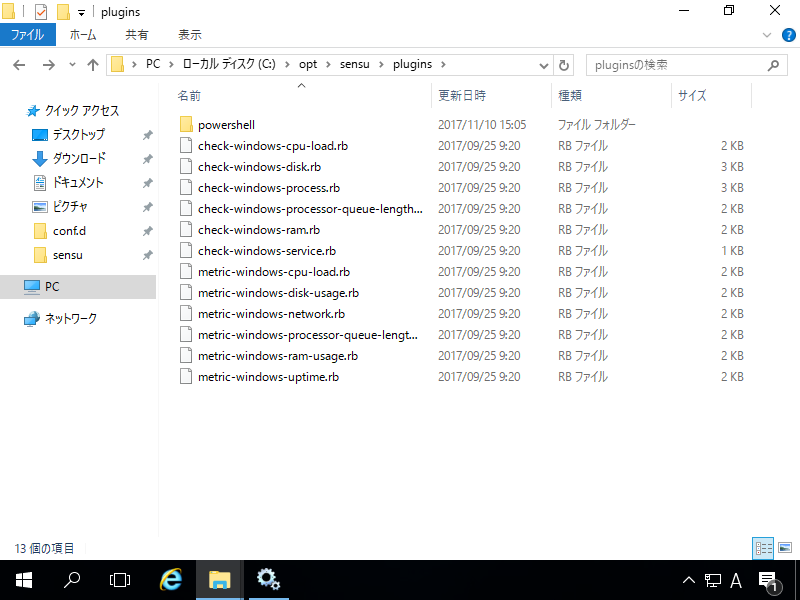
| [2] | Create [plugins] folder under the [C:\opt\sensu]. Next extract downloaded Zip and then copy all files in [sensu-plugins-windows-master\bin] (extracted folder) to [C:\opt\sensu\plugins]. |
|
| [3] | Configure on Sensu Server for Windows checks. |
|
[root@dlp ~]#
vi /etc/sensu/conf.d/check-win-cpu-load.json # CPU check
{
  "checks": {
    "win_cpu_check": {
      "command": "C:\\opt\\sensu\\embedded\\bin\\ruby C:\\opt\\sensu\\plugins\\check-windows-cpu-load.rb -w 80 -c 90",
      "subscribers": [ "windows-server" ],
      "interval": 60
    }
  }
}
[root@dlp ~]#
vi /etc/sensu/conf.d/metrics-win-cpu-load.json # CPU metric
{
  "checks": {
    "metrics_win_cpu-load": {
      "type": "metric",
      "command": "C:\\opt\\sensu\\embedded\\bin\\ruby C:\\opt\\sensu\\plugins\\metric-windows-cpu-load.rb --scheme :::name:::.cpu_load",
      "interval": 60,
      "output_format": "graphite_plaintext",
      "subscribers": [ "windows-server" ],
      "handlers": [ "graphite" ]
    }
  }
}
[root@dlp ~]#
vi /etc/sensu/conf.d/check-win-memory.json # memory check
{
  "checks": {
    "win_memory_check": {
      "command": "C:\\opt\\sensu\\embedded\\bin\\ruby C:\\opt\\sensu\\plugins\\check-windows-ram.rb -w 80 -c 90",
      "subscribers": [ "windows-server" ],
      "interval": 60
    }
  }
}
[root@dlp ~]#
vi /etc/sensu/conf.d/metrics-win-memory.json # memory metric
{
  "checks": {
    "metrics_win_memory-usage": {
      "type": "metric",
      "command": "C:\\opt\\sensu\\embedded\\bin\\ruby C:\\opt\\sensu\\plugins\\metric-windows-ram-usage.rb --scheme :::name:::.memory_usage",
      "interval": 60,
      "output_format": "graphite_plaintext",
      "subscribers": [ "windows-server" ],
      "handlers": [ "graphite" ]
    }
  }
}
[root@dlp ~]#
vi /etc/sensu/conf.d/check-win-disk-usage.json # disk check
{
  "checks": {
    "win_disk_check": {
      "command": "C:\\opt\\sensu\\embedded\\bin\\ruby C:\\opt\\sensu\\plugins\\check-windows-disk.rb -w 80 -c 90",
      "subscribers": [ "windows-server" ],
      "interval": 60
    }
  }
}
[root@dlp ~]#
vi /etc/sensu/conf.d/metrics-win-disk-usage.json # disk metric
{
  "checks": {
    "metrics_win_disk-usage": {
      "type": "metric",
      "command": "C:\\opt\\sensu\\embedded\\bin\\ruby C:\\opt\\sensu\\plugins\\metric-windows-disk-usage.rb --scheme :::name:::.disk_usage",
      "interval": 60,
      "output_format": "graphite_plaintext",
      "subscribers": [ "windows-server" ],
      "handlers": [ "graphite" ]
    }
  }
}
[root@dlp ~]#
vi /etc/sensu/conf.d/check-win-svc.json # service check (follow is checking dns.exe service)
{
  "checks": {
    "win_svc_check": {
      "command": "C:\\opt\\sensu\\embedded\\bin\\ruby C:\\opt\\sensu\\plugins\\check-windows-service.rb -s dns.exe",
      "subscribers": [ "windows-server" ],
      "interval": 60
    }
  }
}
[root@dlp ~]#
vi /etc/sensu/conf.d/metrics-win-net.json # network metric
{
  "checks": {
    "metrics_win_net-usage": {
      "type": "metric",
      "command": "C:\\opt\\sensu\\embedded\\bin\\ruby C:\\opt\\sensu\\plugins\\metric-windows-network.rb --scheme :::name:::.network",
      "interval": 60,
      "output_format": "graphite_plaintext",
      "subscribers": [ "windows-server" ],
      "handlers": [ "graphite" ]
    }
  }
}
systemctl restart sensu-server sensu-api |
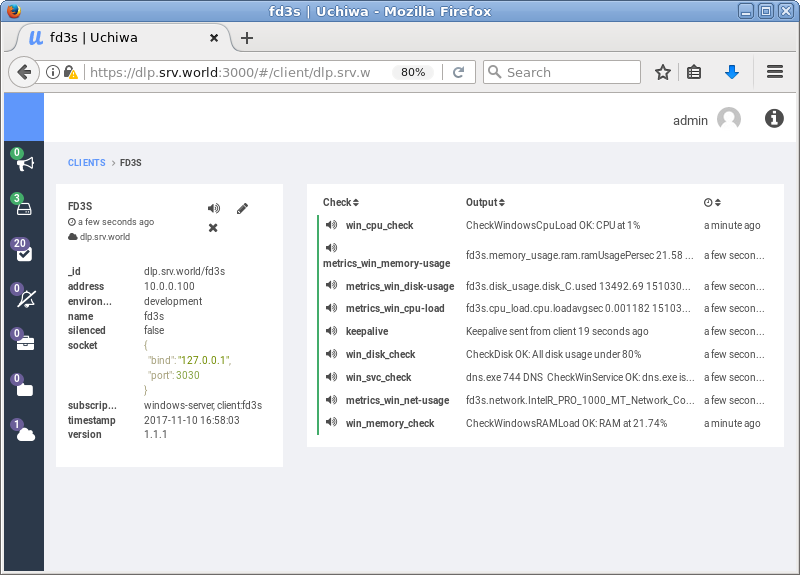
| [4] | Access to Uchiwa Dashboard and verify new metric collection checks are shown normally. |
|
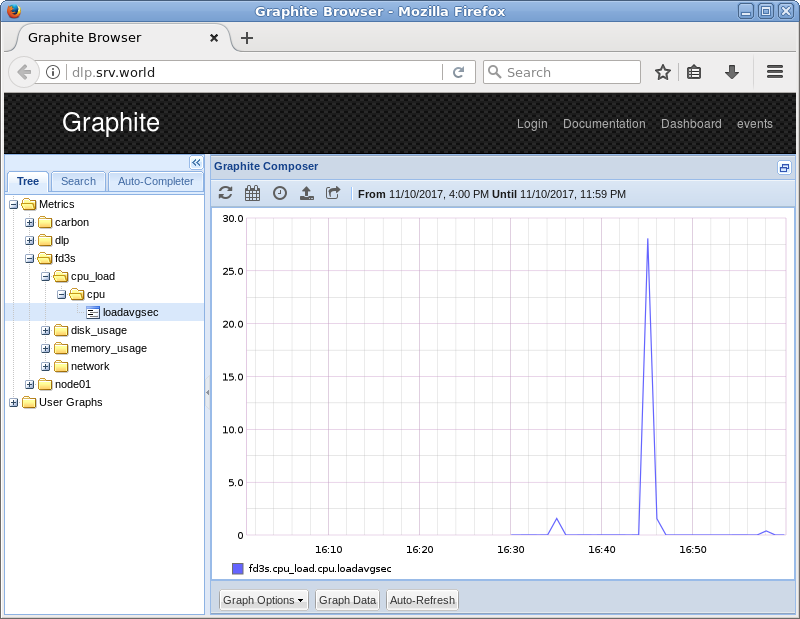
| [5] | Access to Graphite Web to see metrics with Graphs. |
|
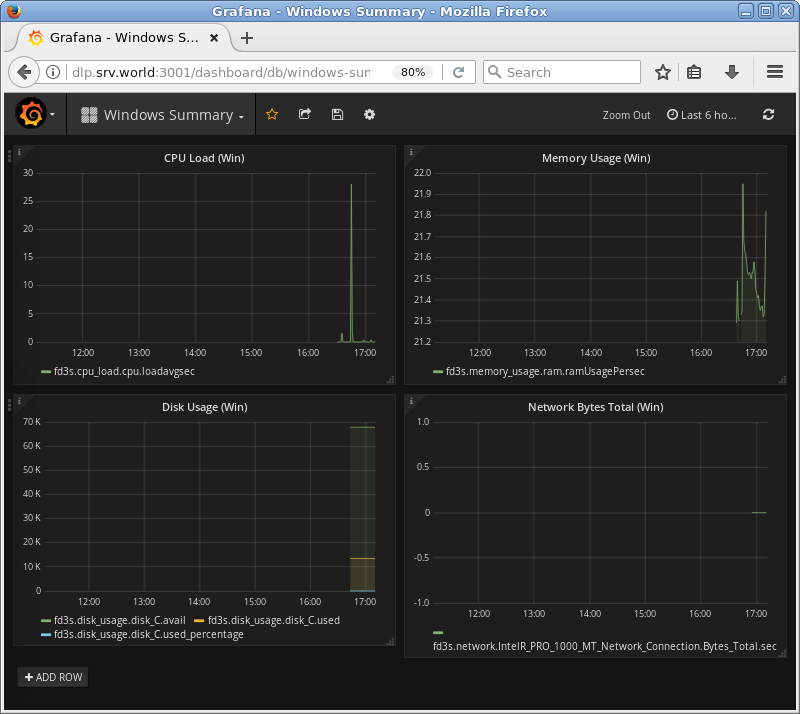
| [6] | If set Grafana web, it's also possible to see Graphs. |
|
Matched Content