Sensu : Set Metric Collection Check2017/11/05 |
|
Set Metric Collection Check to Visualize Server Resource.
To save metric data, install Graphite on this example. |
|
| [1] | |
| [2] | Set Metric Collection Check. For example, Set a tool that is included in CPU check plugin package. |
|
# tools in CPU check plugin package [root@dlp ~]# ll /opt/sensu/embedded/lib/ruby/gems/2.4.0/gems/sensu-plugins-cpu-checks-1.1.2/bin total 32 -rwxr-xr-x. 1 root root 4100 Oct 26 11:57 check-cpu.rb -rwxr-xr-x. 1 root root 1658 Oct 26 11:57 check-cpu.sh -rwxr-xr-x. 1 root root 1998 Oct 26 11:57 metrics-cpu-mpstat.rb -rwxr-xr-x. 1 root root 2236 Oct 26 11:57 metrics-cpu-pcnt-usage.rb -rwxr-xr-x. 1 root root 1729 Oct 26 11:57 metrics-cpu.rb -rwxr-xr-x. 1 root root 1212 Oct 26 11:57 metrics-numastat.rb -rwxr-xr-x. 1 root root 1964 Oct 26 11:57 metrics-user-pct-usage.rb # for example, set [metrics-cpu-pcnt-usage.rb]
[root@dlp ~]#
vi /etc/sensu/conf.d/metrics-cpu-pcnt-usage.json # create new # to specify [--scheme ***], possible to set data structure to save # for following example, metrics are saved under [/var/lib/carbon/whisper/(hostname)/cpu_pcnt/]
{
  "checks": {
    "metrics_cpu_pcnt-usage": {
      "type": "metric",
      "command": "metrics-cpu-pcnt-usage.rb --scheme :::name:::.cpu_pcnt",
      "interval": 60,
      "output_format": "graphite_plaintext",
      "subscribers": [ "development" ],
      "handlers": [ "graphite" ]
    }
  }
}
[root@dlp ~]#
vi /etc/sensu/conf.d/graphite.json
{
  "handlers": {
    "graphite": {
      "type": "tcp",
      "socket": {
        "host": "127.0.0.1",
        "port": 2003
      },
      "mutator": "only_check_output"
    }
  }
}
systemctl restart sensu-server sensu-api |
| [3] | Access to Uchiwa Dashboard and verify new metric collection check is shown normally. |
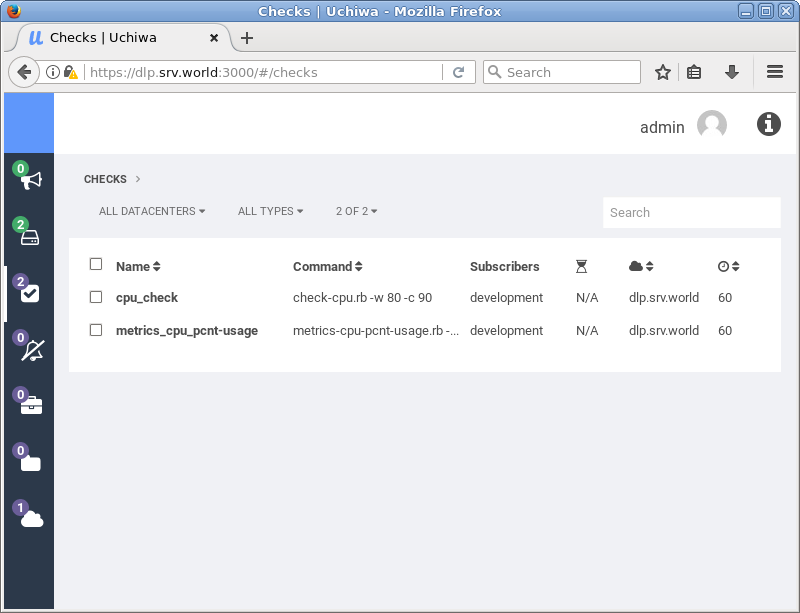
|
| [4] | Access to Graphite Web to see metrics with Graphs. |
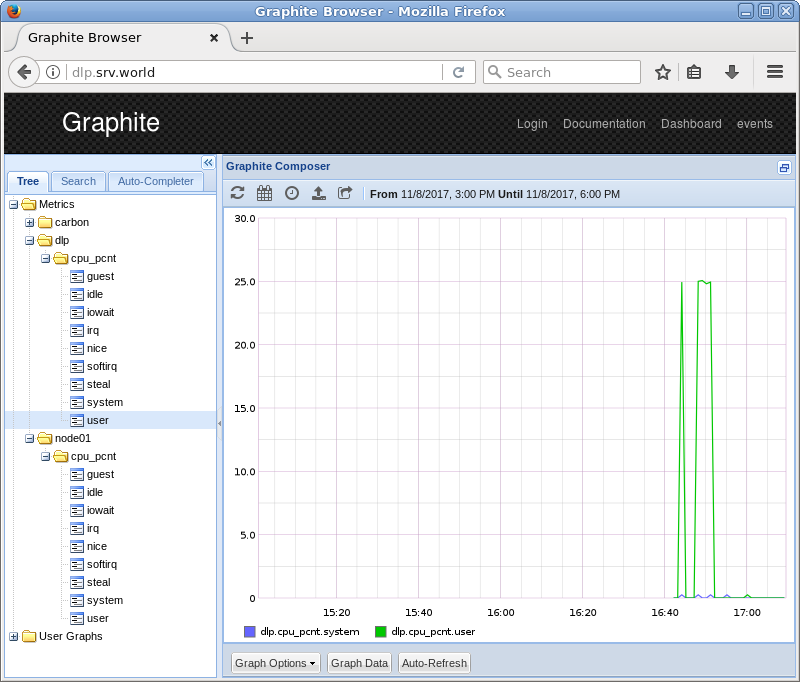
|
Matched Content