Grafana : Install2017/10/26 |
|
Install Web Dashboard tool, Grafana.
Grafana is the visualize tool, so it needs data source from Database System like
Graphite, Prometheus, Elasticsearch, InfluxDB, OpenTSDB, AWS Cloudwatch, MySQL, PostgreSQL.
|
|
| [1] | Install Grafana. |
|
[root@dlp ~]#
cat > /etc/yum.repos.d/grafana.repo <<'EOF'
[grafana] name=grafana baseurl=https://packagecloud.io/grafana/stable/el/7/$basearch gpgkey=https://packagecloud.io/gpg.key https://grafanarel.s3.amazonaws.com/RPM-GPG-KEY-grafana enabled=0 gpgcheck=1 EOF
[root@dlp ~]#
yum --enablerepo=grafana -y install grafana initscripts fontconfig
[root@dlp ~]#
vi /etc/grafana/grafana.ini # line 30: uncomment (if you use SSL/TLS, change to [https]) protocol = http # line 36: uncomment (if you'd like to use another port, change it) http_port = 3000 # line 39: uncomment (if you'd like to change display domain name, change it) domain = dlp.srv.world
systemctl start grafana-server [root@dlp ~]# systemctl enable grafana-server
|
| [2] | If Firewalld is running, allow service port. |
|
[root@dlp ~]# firewall-cmd --add-port=3000/tcp --permanent success [root@dlp ~]# firewall-cmd --reload success |
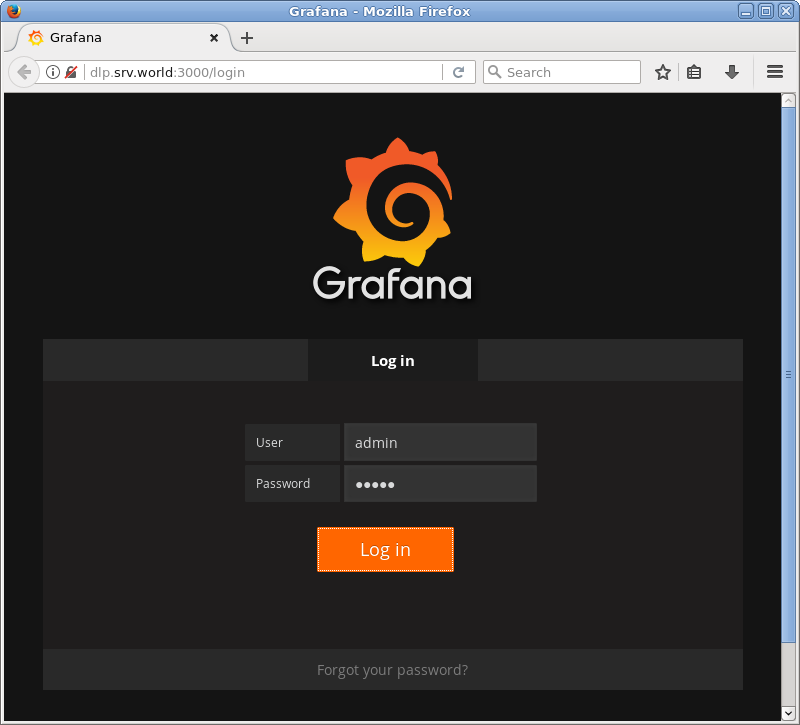
| [3] | Access to [http://(Grafana server's hostname or IP address):3000/] from any Clients with web browser, then, Grafana login form is shown like follows. It's possible to login with [admin] user and with the default password [admin]. |
|
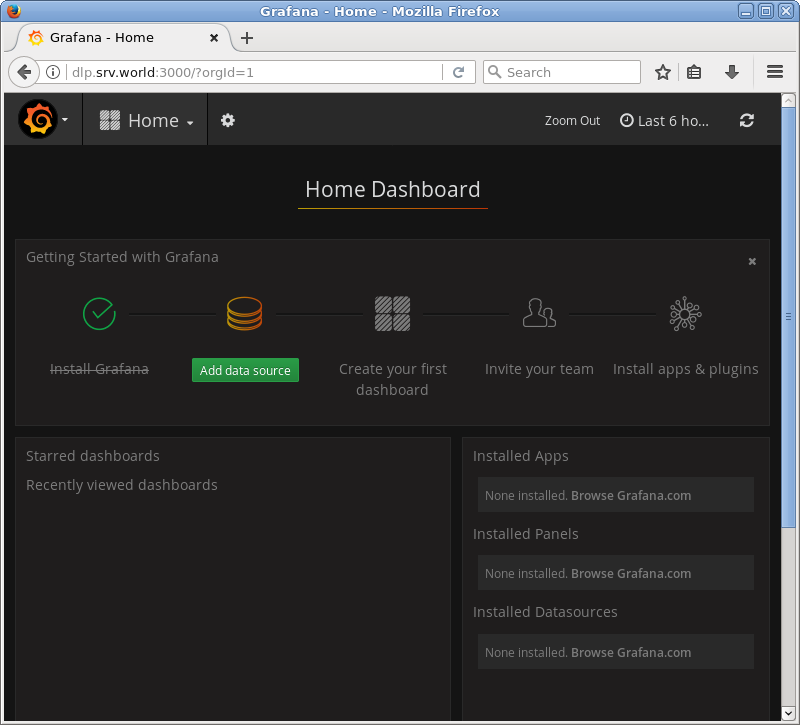
| [4] | After login normally, Grafana Home is shown. |
|
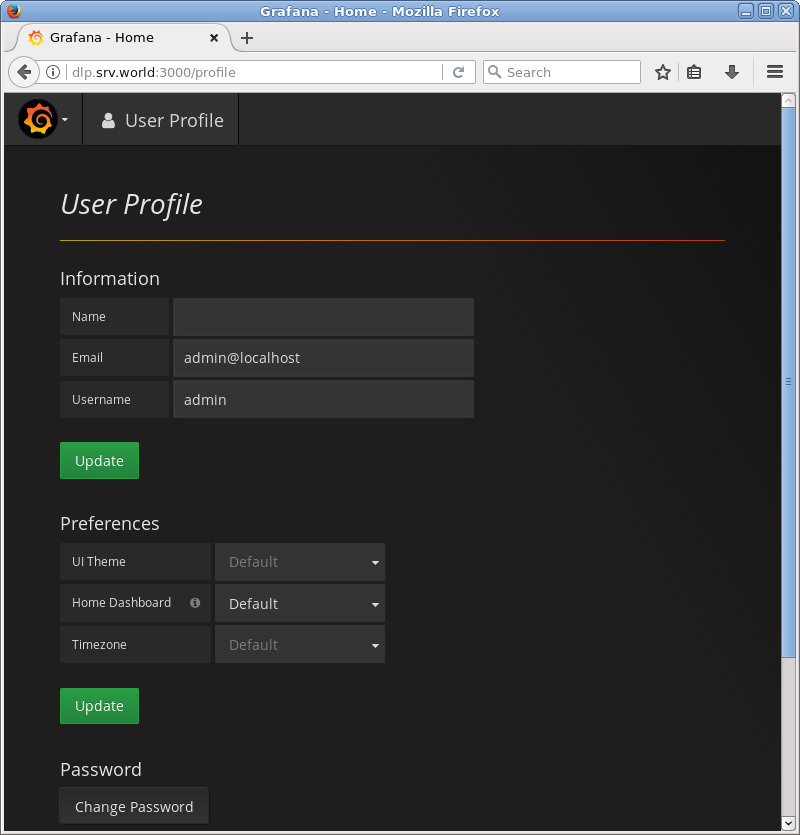
| [5] | First, Change admin password to strong one on User Profile setting. |
|
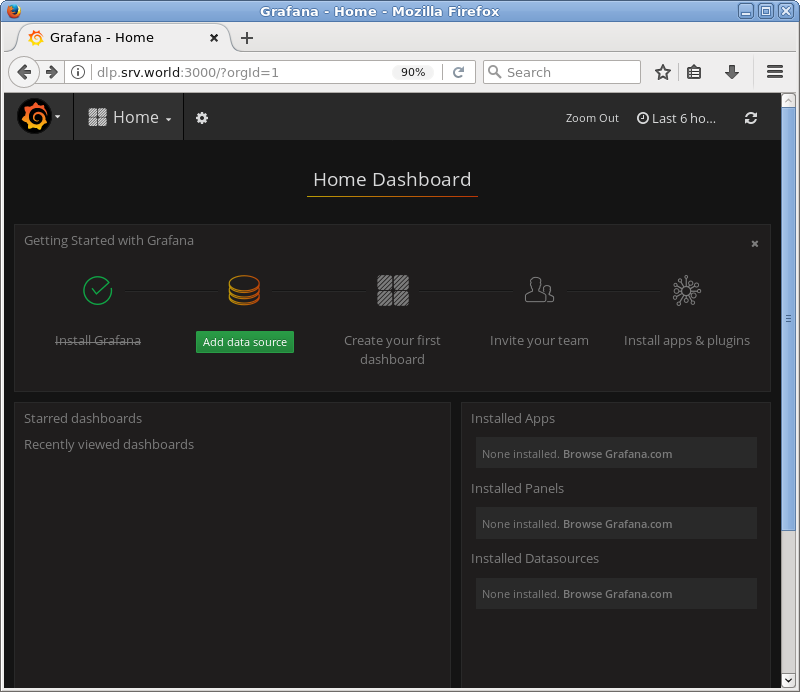
| [6] | It's OK to install Grafana. Additionally, for example, create a dashboard with Graphite data source. Click [Add data source] on the Home screen. |
|
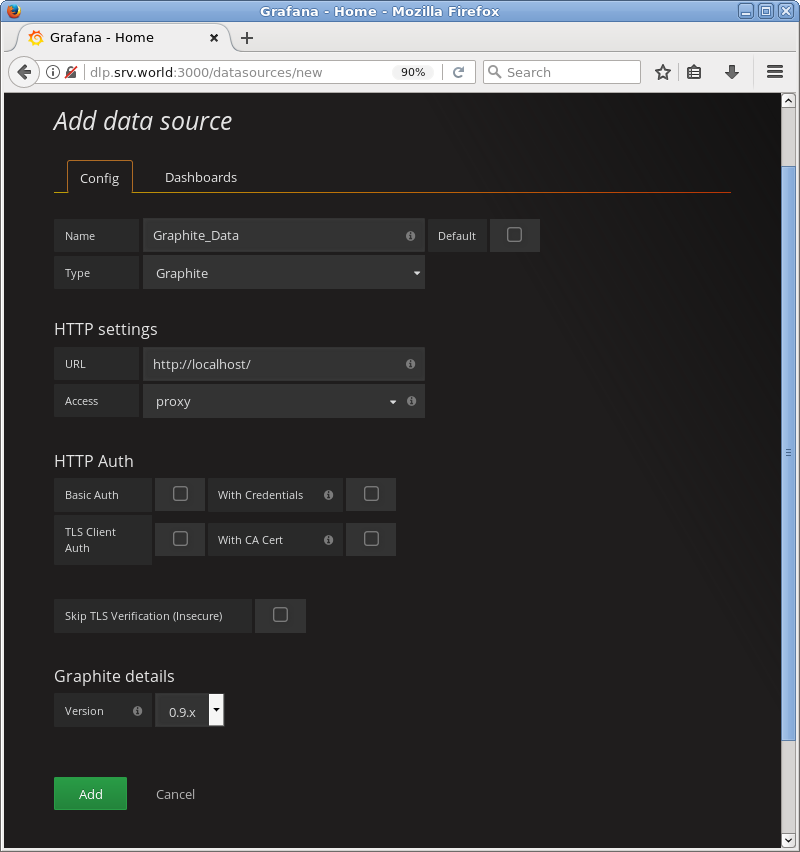
| [7] | For [Name] field, input any name you like, For [Type] field, select [Graphite]. The environment is based on that Graphite has been installed like here and it is running on localhost. On the environment, For [URL] field, input [http://localhost/], and For [Access] field, select [proxy]. It's OK for minimum settings, Click [Add] button to proceed. |
|
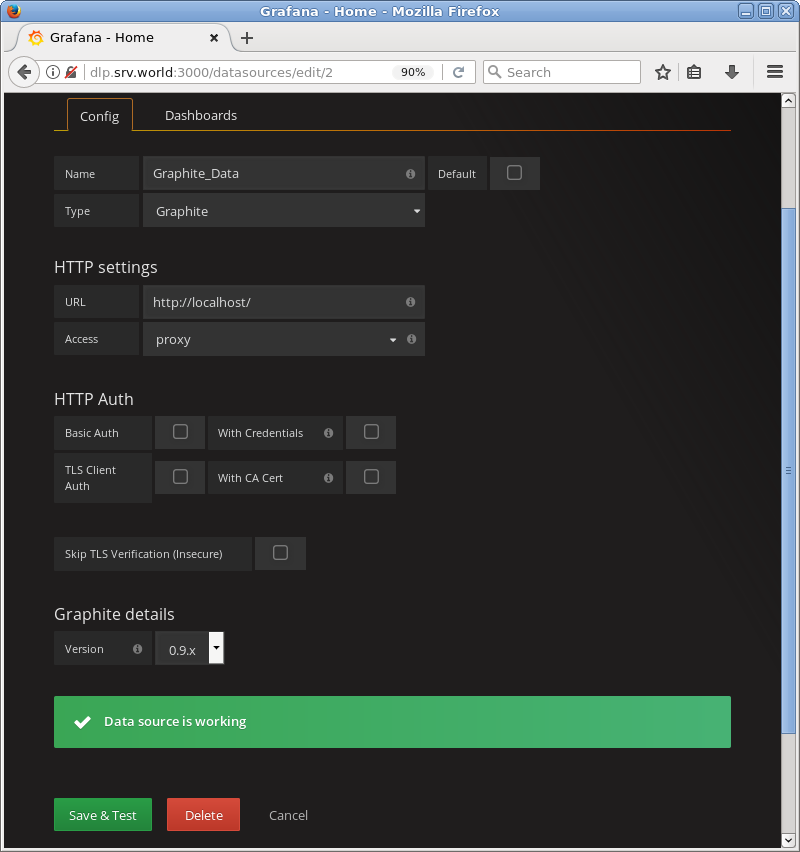
| [8] | After adding normally, [Data source is working] is shown. Next, move to the [Dashboards] tab. |
|
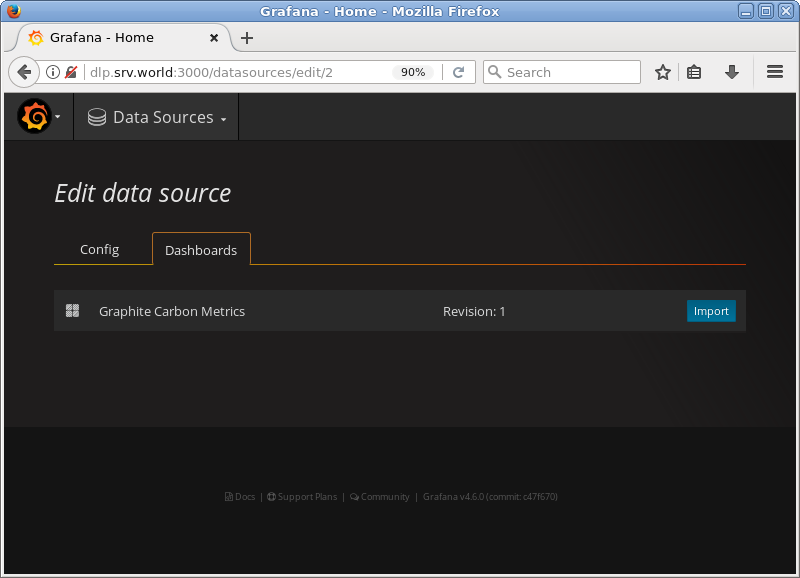
| [9] | Click [Import] button on the right-side. It's OK, back to Home. |
|
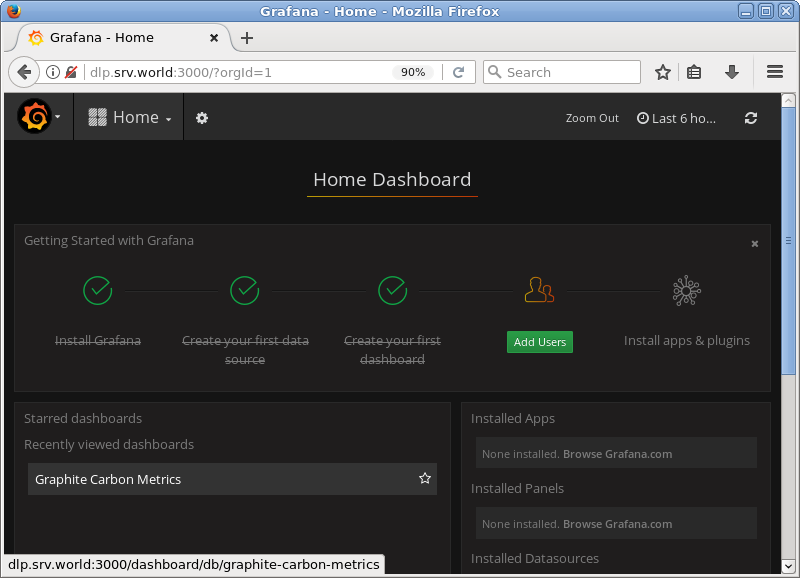
| [10] | On the Home, added dashboard is put like follows, Click it to move. |
|
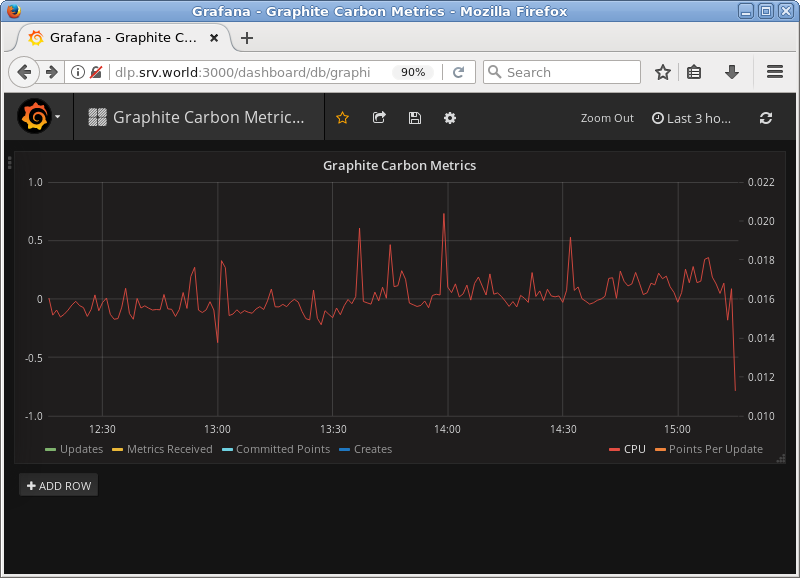
| [11] | You can see Graphs from Graphite data source. |
|
Matched Content