Elastic Stack 7 : X-Pack.Monitoring2019/06/18 |
|
Configure X-Pack.Monitoring which monitors Elasticsearch or Kibana and so on.
Most plugins included in X-Pack are not for free, so you mush buy licenses to use.
However, you can try to use for 30 days with trial license.
Refer to the official site about subscription below.
⇒ https://www.elastic.co/subscriptions |
|
| [1] |
From Elastic Stack 7, X-Pack is installed by default, so it's not need to install it manualy.
|
| [2] |
Configure X-Pack.Monitoring on all Nodes that Elasticsearch is running.
About features of X-Pack, refer to the official site below.On this example, Disable most features like Security first. If you enable them, refer to the next tutorial. ⇒ https://www.elastic.co/guide/en/elasticsearch/reference/current/settings-xpack.html |
|
[root@dlp ~]#
vi /etc/elasticsearch/elasticsearch.yml # add to the end # set license type (follow is the trial license) xpack.license.self_generated.type: trial # set Monitoring (enabled) xpack.monitoring.collection.enabled: true # set Security (disabled) xpack.security.enabled: false
[root@dlp ~]#
systemctl restart elasticsearch kibana logstash # access to show the index list ,then you can find new data from Monitoring [root@dlp ~]# curl localhost:9200/_cat/indices?v health status index uuid pri rep docs.count docs.deleted store.size pri.store.size green open winlogbeat-7.1.1-2019.06.18-000001 9mTTgj-TQa2BqFP2e9CGvQ 1 1 1332 0 2.7mb 1.4mb green open .kibana_1 hF7j0i5iRRSa9hAebihkfg 1 1 924 10 1.4mb 759.4kb green open .kibana_task_manager vxyGU_agTXyFTLac6lDMYg 1 1 2 0 25.6kb 12.8kb green open .monitoring-es-7-2019.06.18 M5L-X5qFQ5WbUfsBcHdkeA 1 1 342 272 1.2mb 643.8kb green open metricbeat-7.1.1-2019.06.18-000001 cXFRA4p3SaO_Jaahxxx-hw 1 1 7007 0 9.3mb 4.6mb green open .monitoring-kibana-7-2019.06.18 nDKEG9fVQWKY9k4iU-nvoQ 1 1 18 0 264.1kb 132kb green open sshd_fail-2019.06 Mu9wxqZPTkK2X9biuvGP1g 1 1 38 0 147kb 73.5kb green open packetbeat-7.1.1-2019.06.18-000001 1uSGzcBjQXO4VlTOKqtNSA 1 1 14887 0 22.8mb 11.3mb |
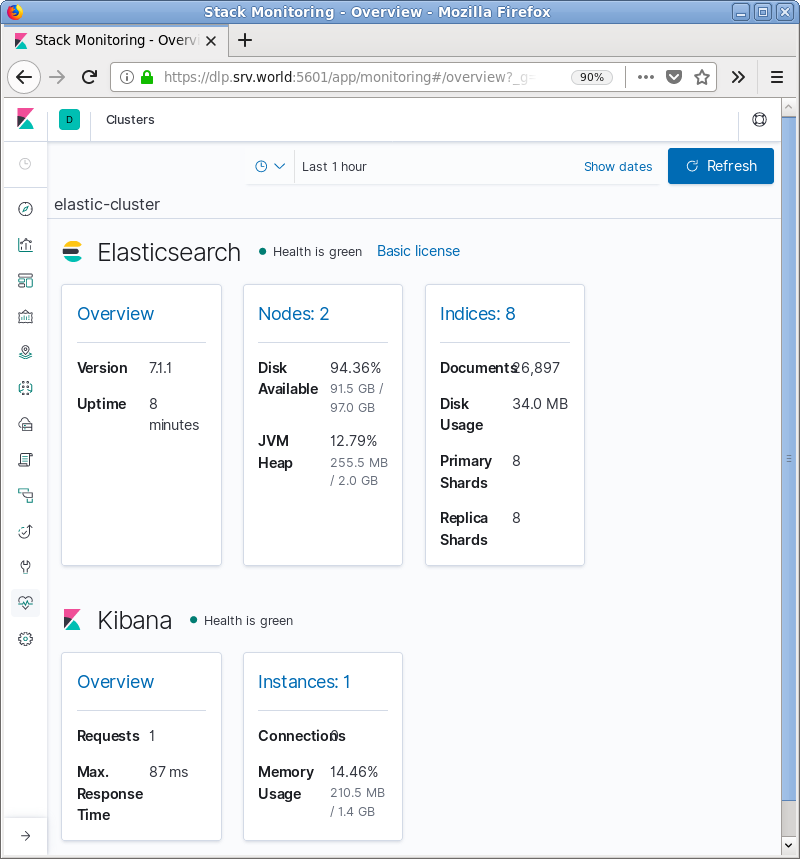
| [3] | If Kibana is running, you can find new data from Monitoring on Kibana, too. |
|
Matched Content