Elastic Stack 5 : Install Packetbeat2017/05/11 |
|
Install Packetbeat that collects and analyze Network packets.
|
|
| [1] | Install Packetbeat. Configure Elasticsearch repository before it. |
|
[root@dlp ~]# yum -y install packetbeat
|
| [2] | Configure basic settings and start Packetbeat. |
|
[root@dlp ~]#
vi /etc/packetbeat/packetbeat.yml # line 29: set items # if disable ICMPv4/ICMPv6, turn to false # line 33: many items are targeted as monitoring by default, # but if not need, comment out the line [packetbeat.protocols.*** --- ports: ***] packetbeat.protocols.icmp: # Enable ICMPv4 and ICMPv6 monitoring. Default: false enabled: true packetbeat.protocols.amqp: # Configure the ports where to listen for AMQP traffic. You can disable # the AMQP protocol by commenting out the list of ports. ports: [5672] ..... ..... # line 116: specify output destination # by default, it set to Elasticsearch on localhost # if output to Logstash, comment out there lines and uncomment the line 126,128 output.elasticsearch: # Array of hosts to connect to.l hosts: ["localhost:9200"] ..... ..... #output.logstash: # The Logstash hosts #hosts: ["localhost:5044"][root@dlp ~]# systemctl start packetbeat [root@dlp ~]# systemctl enable packetbeat
|
| [3] | Make sure the data has been collected normally. |
|
# index list [root@dlp ~]# curl localhost:9200/_cat/indices?v health status index uuid pri rep docs.count docs.deleted store.size pri.store.size yellow open metricbeat-2017.05.12 YvHWPjbgS12e_oU5Ddi3rA 5 1 170617 0 43.7mb 43.7mb yellow open packetbeat-2017.05.12 ZzVaYEjYSNyRGMIHNEaVnw 5 1 7 0 8.6kb 8.6kb yellow open sshd_fail-2017.05 owhoRGiwTWGdZaqKAMw66g 5 1 77 0 233.8kb 233.8kb yellow open .kibana FGjE6bGUTlioELtM_QynMQ 1 1 107 27 210.9kb 210.9kb # document list on the index [root@dlp ~]# curl localhost:9200/packetbeat-2017.05.12/_search?pretty
{
  "took" : 2,
  "timed_out" : false,
  "_shards" : {
    "total" : 5,
    "successful" : 5,
    "failed" : 0
  },
  "hits" : {
    "total" : 21,
    "max_score" : 1.0,
    "hits" : [
      {
        "_index" : "packetbeat-2017.05.12",
        "_type" : "nfs",
.....
.....
|
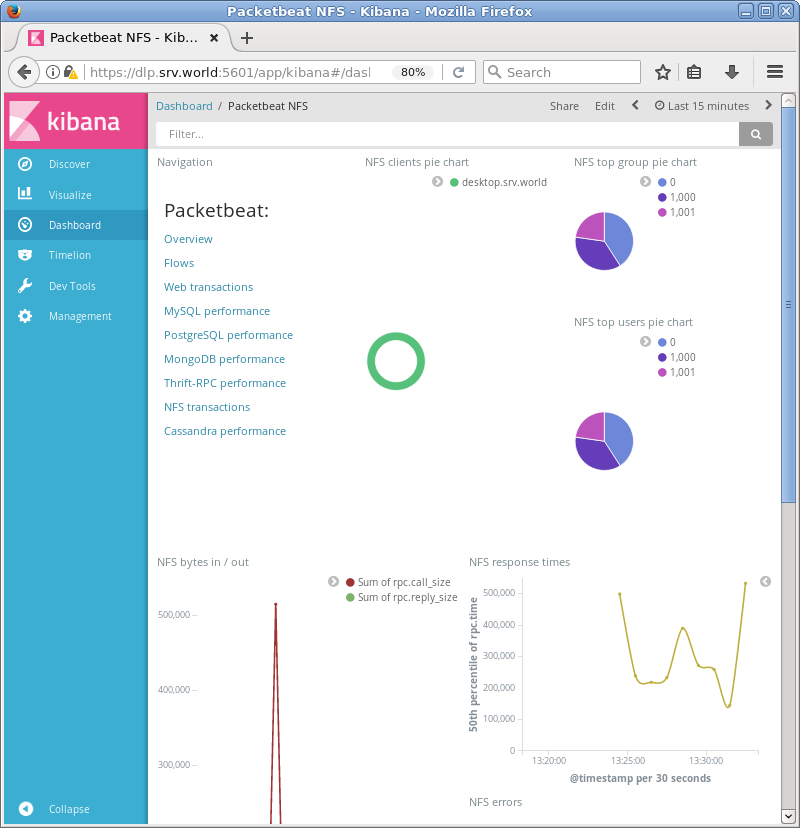
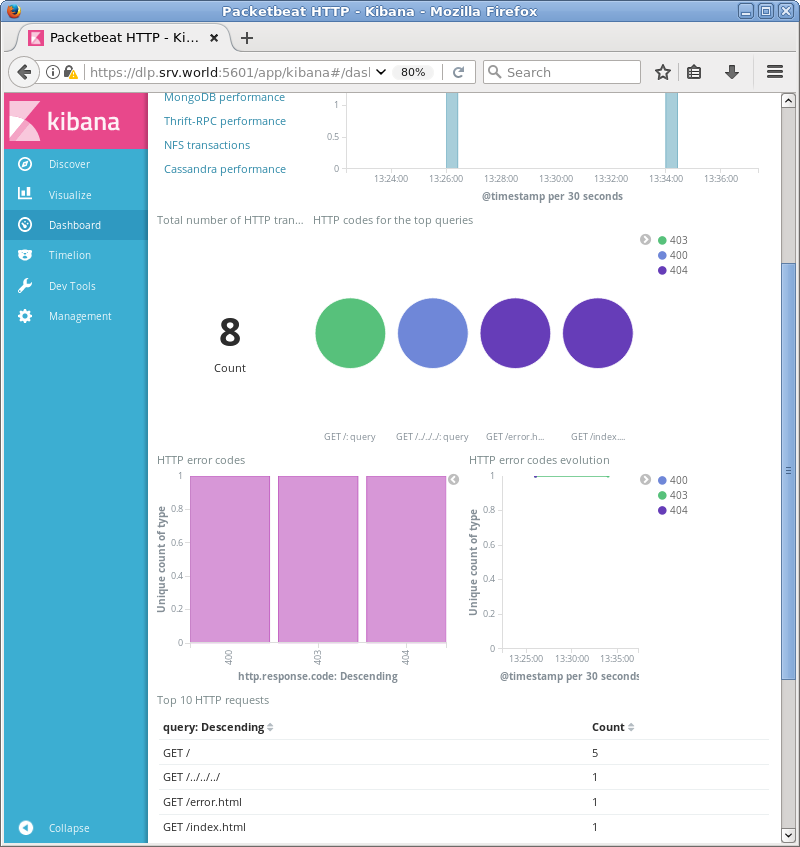
| [4] | If Kibana is running, it's possible to use import script to Dashboard. |
|
[root@dlp ~]# /usr/share/packetbeat/scripts/import_dashboards Create temporary directory /tmp/tmp664402863 Downloading https://artifacts.elastic.co/downloads/beats/beats-dashboards/beats-dashboards-5.4.0.zip Unzip archive /tmp/tmp664402863 Importing Kibana from /tmp/tmp664402863/beats-dashboards-5.4.0/filebeat Importing Kibana from /tmp/tmp664402863/beats-dashboards-5.4.0/heartbeat ..... ..... |
|
|
Matched Content