Cacti : Add Monitoring Host2015/06/16 |
|
Add Monitoring Target Host on the network.
|
|
| [1] | Install SNMP on the target host you'd like to monitor. |
|
[root@node01 ~]#
yum -y install net-snmp net-snmp-utils
[root@node01 ~]#
vi /etc/snmp/snmpd.conf # line 41: comment out # com2sec notConfigUser default public
# line 74,75: uncomment and change # change "mynetwork" to your own network # change comunity name to anyone except public, private (for security reason) com2sec local localhost Serverworld com2sec mynetwork 10.0.0.0/24 Serverworld
# line 78,79: uncomment and change group MyRWGroup v2c localgroup MyROGroup v2c mynetwork
# line 85: uncomment view all included .1 80 # line 93,94: uncomment and change access MyROGroup "" v2c noauth exact all none noneaccess MyRWGroup "" v2c noauth exact all all all
# line 323: uncomment disk / 10000 # validation (replace "Serverworld" to the comunity name you set) [root@node01 ~]# snmpwalk -v2c -c Serverworld localhost system SNMPv2-MIB::sysDescr.0 = STRING: Linux node01.srv.world 3.10.0-229.4.2.el7.x86_64 #1 SMP Wed May 13..... SNMPv2-MIB::sysObjectID.0 = OID: NET-SNMP-MIB::netSnmpAgentOIDs.10 DISMAN-EVENT-MIB::sysUpTimeInstance = Timeticks: (3367) 0:00:33.67 SNMPv2-MIB::sysContact.0 = STRING: Root <root@localhost> (configure /etc/snmp/snmp.local.conf) ... ... SNMPv2-MIB::sysORUpTime.9 = Timeticks: (4) 0:00:00.04 SNMPv2-MIB::sysORUpTime.10 = Timeticks: (4) 0:00:00.04 |
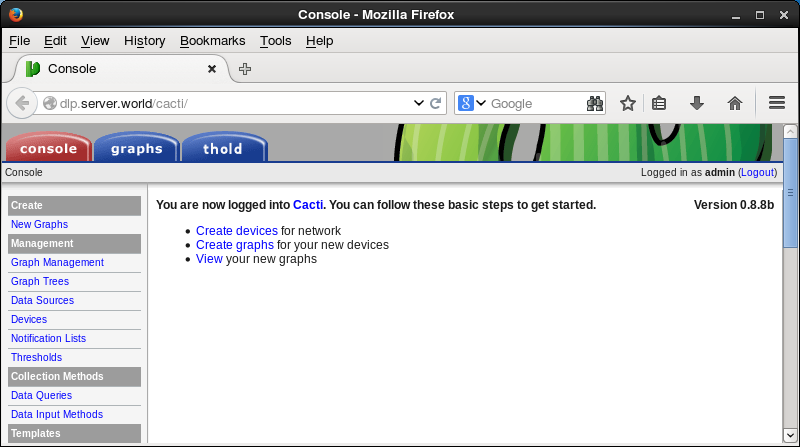
| [2] | Login to Cacti admin site and click "Devices" on the left menu. |
|
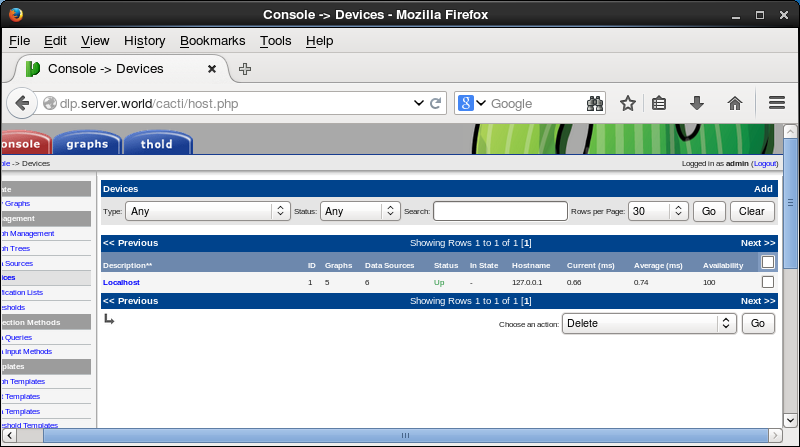
| [3] | Click "Add" in the right pane. |
|
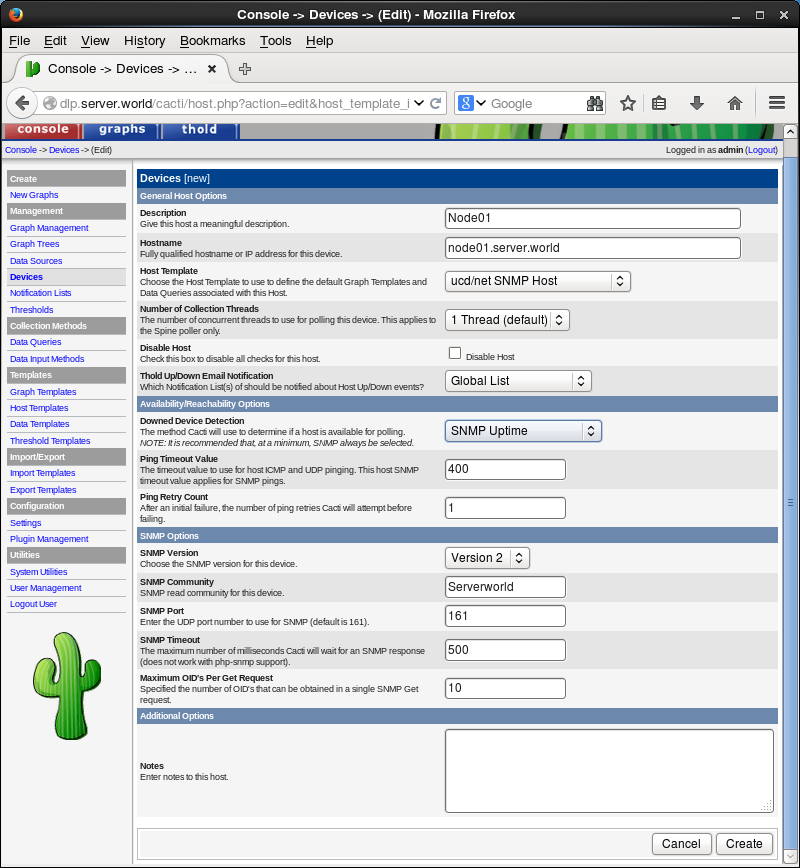
| [4] | Input items like follows and click "Create" button. Description ⇒ simply description Hostname ⇒ target's hostname or IP address Host Template ⇒ ucd/net SNMP Host SNMP Comunity ⇒ the comunity name you set in [1] |
|
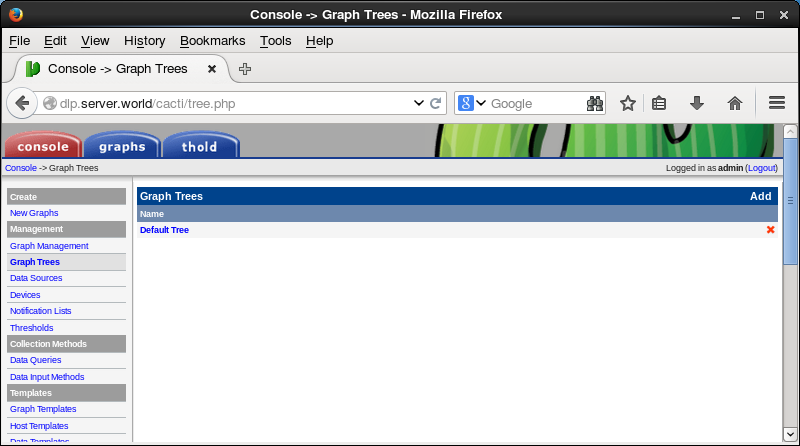
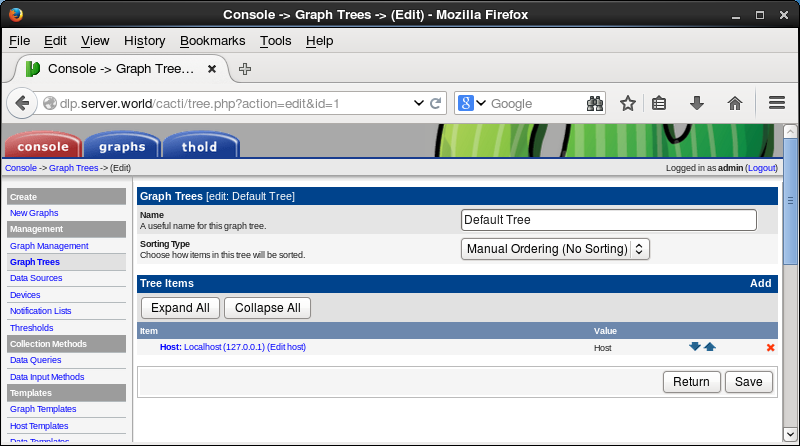
| [5] | After saving settings, click "Graph Trees" on the left menu and click "Default Tree" in the right pane. |
|
| [6] | Click "Add" in the right pane. |
|
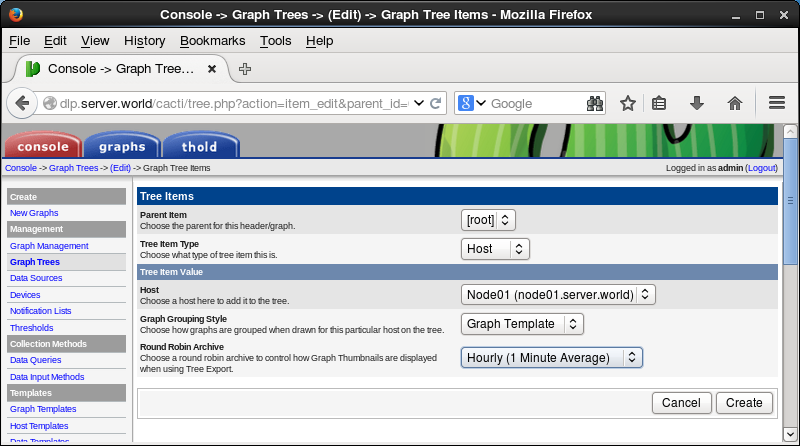
| [7] | Select "Host" in "Tree Item Type" field and select target Host in "Host" field and then click "Create" button. |
|
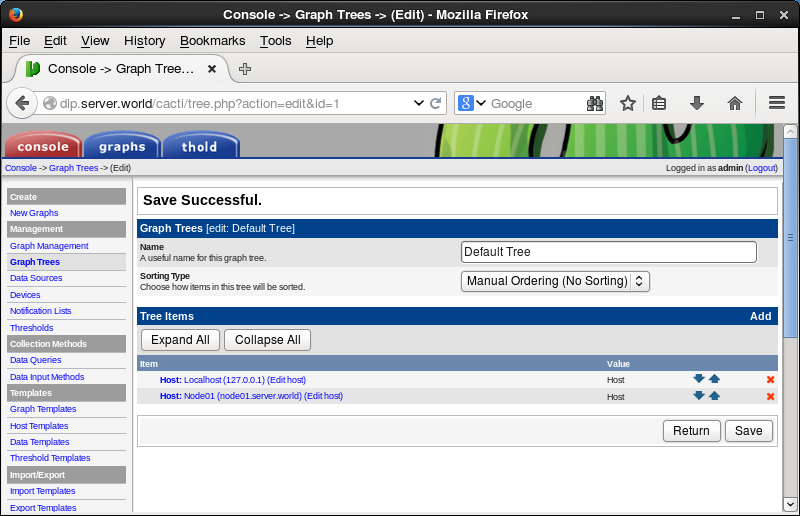
| [8] | Click "Save" button. |
|
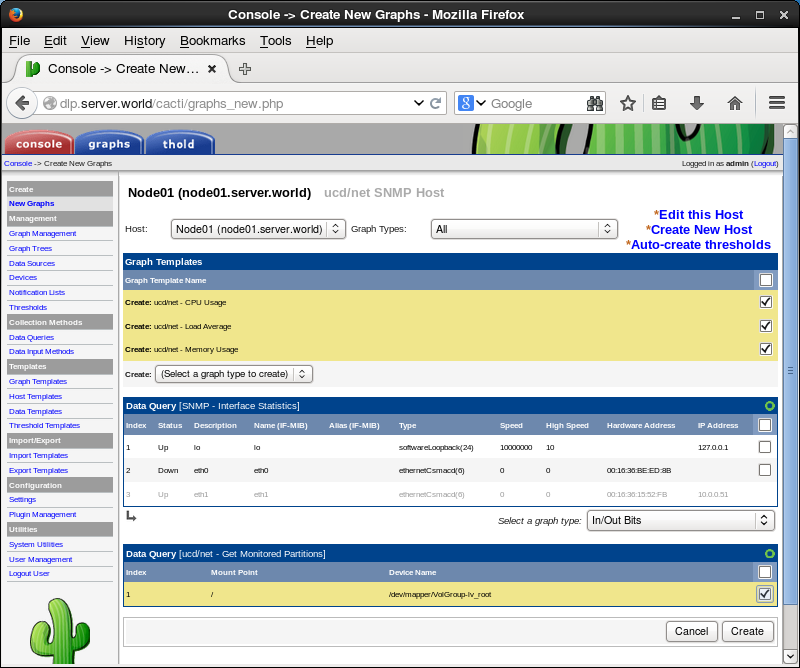
| [9] | Click "New Graphs" on the left menu and select graphs you'd like to add in the right pane and then click "Create" button. |
|
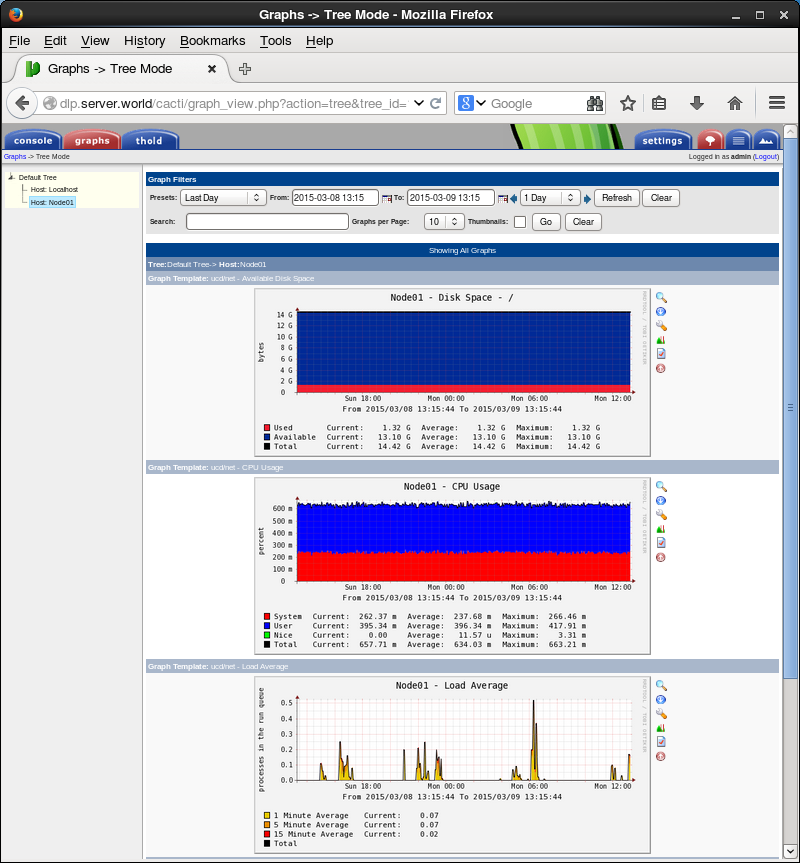
| [10] | After few minutes later, move to the "graphs" tab to view the system status to select the new target host on the left menu like follows. |
|
Matched Content